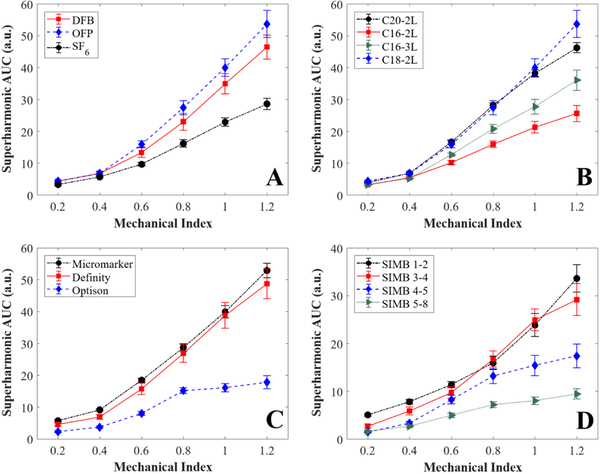
Figure 4: Summary of results.
Comparison of: A) clinical and preclinical contrast agents, B) contrast agents with different gas cores, C) contrast agents with different lipid shell compositions, and D) contrast agents with different bubble diameters. Data are presented as mean ± standard error for n = 12 trials per contrast agent. AUC = area under the curve, OFP = octafluoropropane, DFB = decafluorobutane, SF6 = sulfur hexafluoride.

