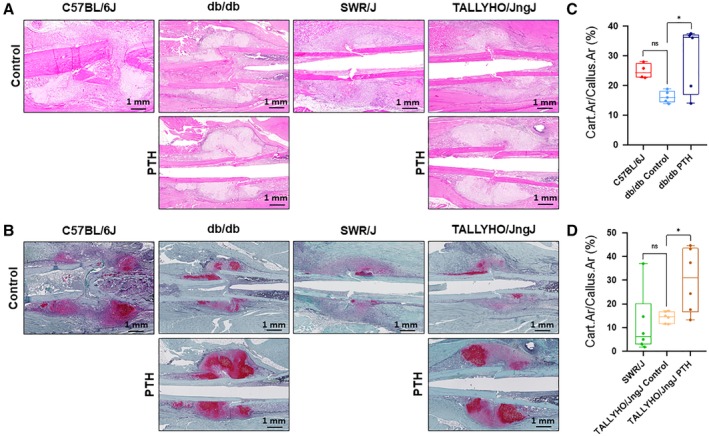
Figure 4.

Safranin O staining for cartilage deposition in fracture callus. (A) Representative H&E histology of fracture calluses. (B) Representative safranin O staining of fracture calluses. (C,D) quantification of cartilage area in calluses from 10‐week‐old mice treated with 40 μg / kg hPTH (1–34) or without intervention are shown at day 7 postfracture. In untreated db/db mice, the average cartilage to callus area was 16.3 ± 2.0% (n = 5), whereas in db/db mice treated with hPTH (1–34) the average cartilage‐to‐callus area was 28.9 ± 11.1% (n = 5; p = 0.0274). C57BL/6J mice showed an average cartilage‐to‐callus area of 24.9 ± 2.6% (n = 4). Untreated TALLYHO/JngJ mice showed an average cartilage‐to‐callus area of 14.4 ± 2.4% (n = 6), whereas treated mice showed an increased average area of 30.1 ± 13.5% (n = 6; p = 0.0471). SWR/J mice showed an average cartilage‐to‐callus area of 11.6 ± 13.3% (n = 6). The difference between C57BL/6J and db/db control was not significant (p = 0.157). The difference between SWR/J and TALLYHO/JngJ control was not significant (p = 0.868). Red staining on safranin O denotes cartilage deposition. Measurements were performed using ImageJ software. ns = p ≥ 0.05, *p < 0.05; one‐way ANOVA.
