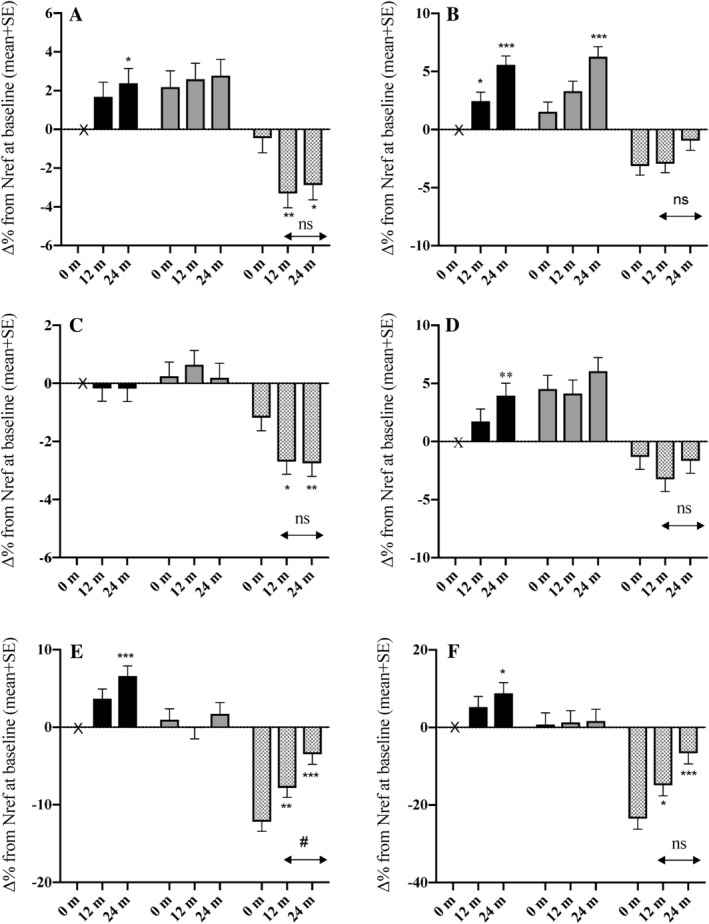
Figure 2.

Differences between groups in percentage change in BMI, body composition, and areal bone mineral density (aBMD) by 12 and 24 months. (A) lumbar spine aBMD, (B) total hip aBMD, (C) whole body less head aBMD, (D) femoral neck aBMD, (E) BMI, (F) fat:lean2 ratio. Data for each variable at 0 months, 12 months, and 24 months are the percentage difference (∆%) relative to the value of Nref at baseline: black bars = Nref (HIV‐negative women, n = 39), gray bars = ART‐N (women with HIV not ART‐exposed by 24 months, n = 28), hatched bars = ART‐Y (women with HIV who initiated ART before 12 months and continued to 24 months, n = 43). Data were obtained from Scheffé post hoc tests from hierarchical linear models of the variable in natural logarithms with group (Nref/ART‐N/ART‐Y), timepoint (0/12/24 months), ID (nested within group), and a group‐by‐timepoint interaction. Error bars are SE. Significance of change from baseline within each group: *p ≤ 0.05, **p ≤ 0.01, ***p ≤ 0.001. Significance of change within each group between 12 and 24 months: ns = not significant (p > 0.05), #p ≤ 0.05. Significance of differences between groups at each timepoint are given in Supplementary Table S1.
