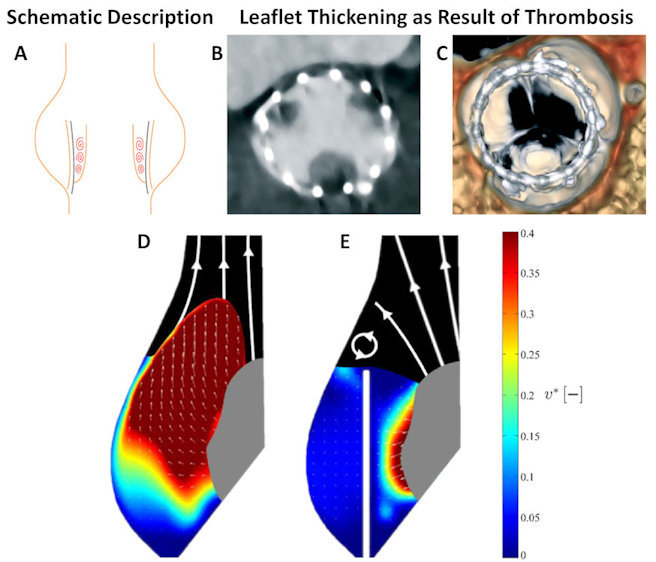
Figure 3. Flow Stasis Post-Transcatheter Aortic Valve Implantation (TAVI) and Leaflet Thickening That Indicates Thrombosis Location.

Schematic description of potential stasis (A). Leaflet thickening as seen in both CT (B) and volume-rendered 4D-CT scans (C). Blood velocity magnitude as measured from in vitro experiment that represents native aortic valve (D) and post-TAVI (E). Blue shades represent stagnation (low velocities). CT scans and experimental results are adapted from Figure 2 of Rosseel et al.49 [CC BY 4.0] and Figure 5 of Ducci et al.50 [CC BY 4.0].
