Figure 3.

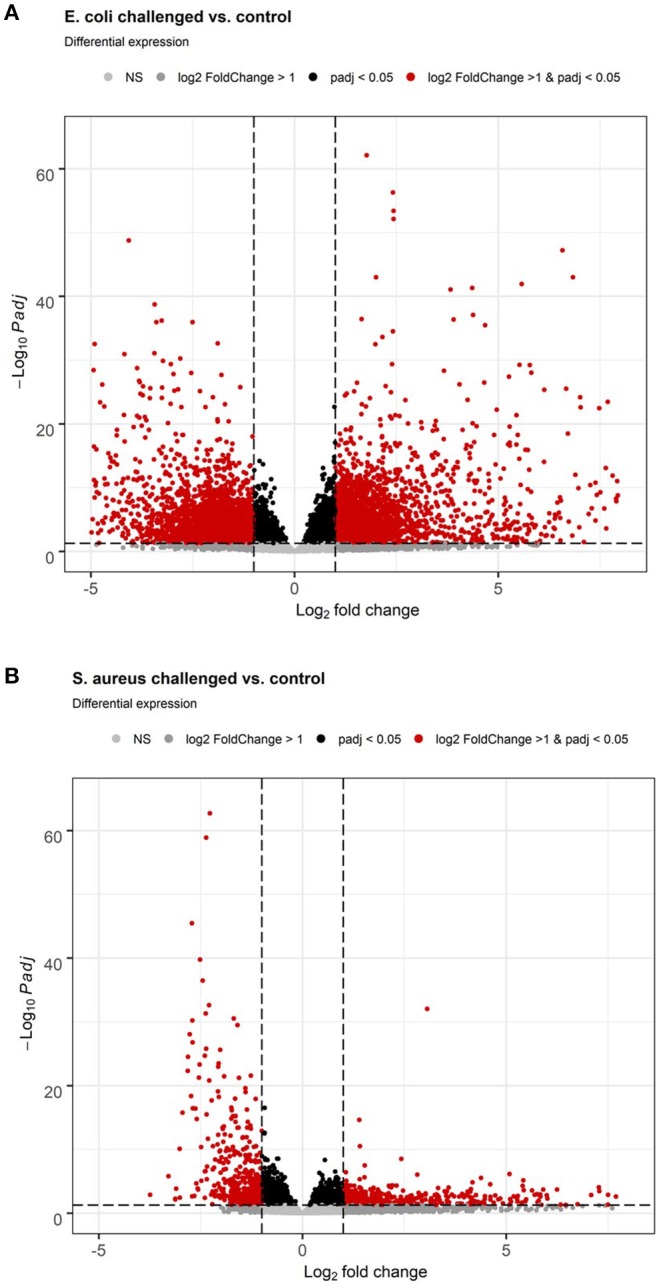
Volcano plot of differential gene expression analysis of the hepatic transcriptome between individuals with intramammary pathogen challenge and controls. (A) E. coli vs. control. (B) S. aureus vs. control.

Volcano plot of differential gene expression analysis of the hepatic transcriptome between individuals with intramammary pathogen challenge and controls. (A) E. coli vs. control. (B) S. aureus vs. control.