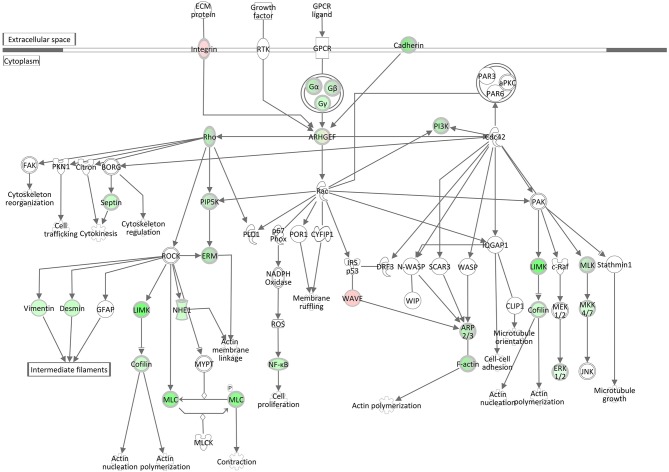
Figure 7.
Gene expression of the signaling by rho family GTPases pathway in the hepatic transcriptome of S. aureus challenged animals compared to the control liver transcriptome: green = lower expression in S. aureus challenged animals compared to untreated control; red = higher expression in S. aureus challenged animals compared to untreated control (adapted from IPA, Qiagen).

