
Fig. 2.
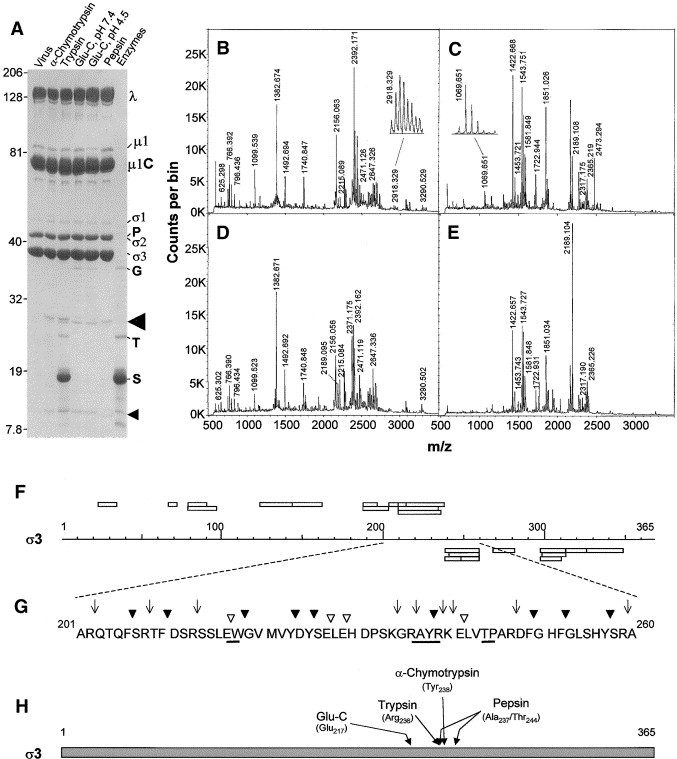
Identification of large and small σ3 peptide fragments. (A) Electrophoretic separation of 2.5 × 10¹¹ virions digested with 10 μg/ml of indicated proteases for 30 s (α-chymotrypsin, trypsin, and pepsin) or for 1.5 h (Glu-C) and resolved in a 6–16% linear gradient SDS–PAGE (16 × 16 × 0.1 cm) at 6.0 W for 5 h. Molecular weights, determined from coelectrophoresis of Kaleidoscope Rainbow Marker, are indicated to left of gel. Virion proteins, enzymes (∼250 ng), and inhibitors (P: pepsin; G: Glu-C; T: trypsin/chymotrypsin; S: soybean trypsin inhibitor), and potential σ3 digestion products (indicated by arrowheads and subsequently analyzed by mass spectrometry) are indicated to right of gel. (B–E) MALDI-Qq-TOF mass spectra obtained from tryptic in-gel digestions of (B) α-chymotrypsin-generated large fragment (indicated by large arrow head in A), (C) α-chymotrypsin-generated small fragment (indicated by small arrow head in A), (D) trypsin-generated large fragment, and (E) trypsin-generated small fragment. Values above peaks indicate measured m/z values of peaks identified as corresponding to virion protein σ3 (shown in Table 1). Peak in B with m/z value of 2918.329 (subsequently shown to correspond to amino acid sequence 214–238) and peak in c with m/z value of 1069.651 (subsequently shown to correspond to amino acid sequence 239–247) are expanded in insets. (F) Diagrammatic representation of strategy to determine where each protease initially cleaves virion-associated σ3. Rectangles above sequence scale correspond to MS-predicted tryptic fragments found in large (∼27-kDa polypeptide) and rectangles below sequence scale correspond to MS-predicted tryptic fragments found in small (∼12.5-kDa polypeptide) as listed in Table 1. (G) Detailed sequence of σ3 protein between amino acid residues 201 and 260, indicating potential cleavage sites for trypsin (▿), α-chymotrypsin (▾), and Glu-C (↓). Underline corresponds to cleavage sites identified as initially used. (H) Diagrammatic representation of entire σ3 protein with initial cleavage sites of tested proteases indicated.