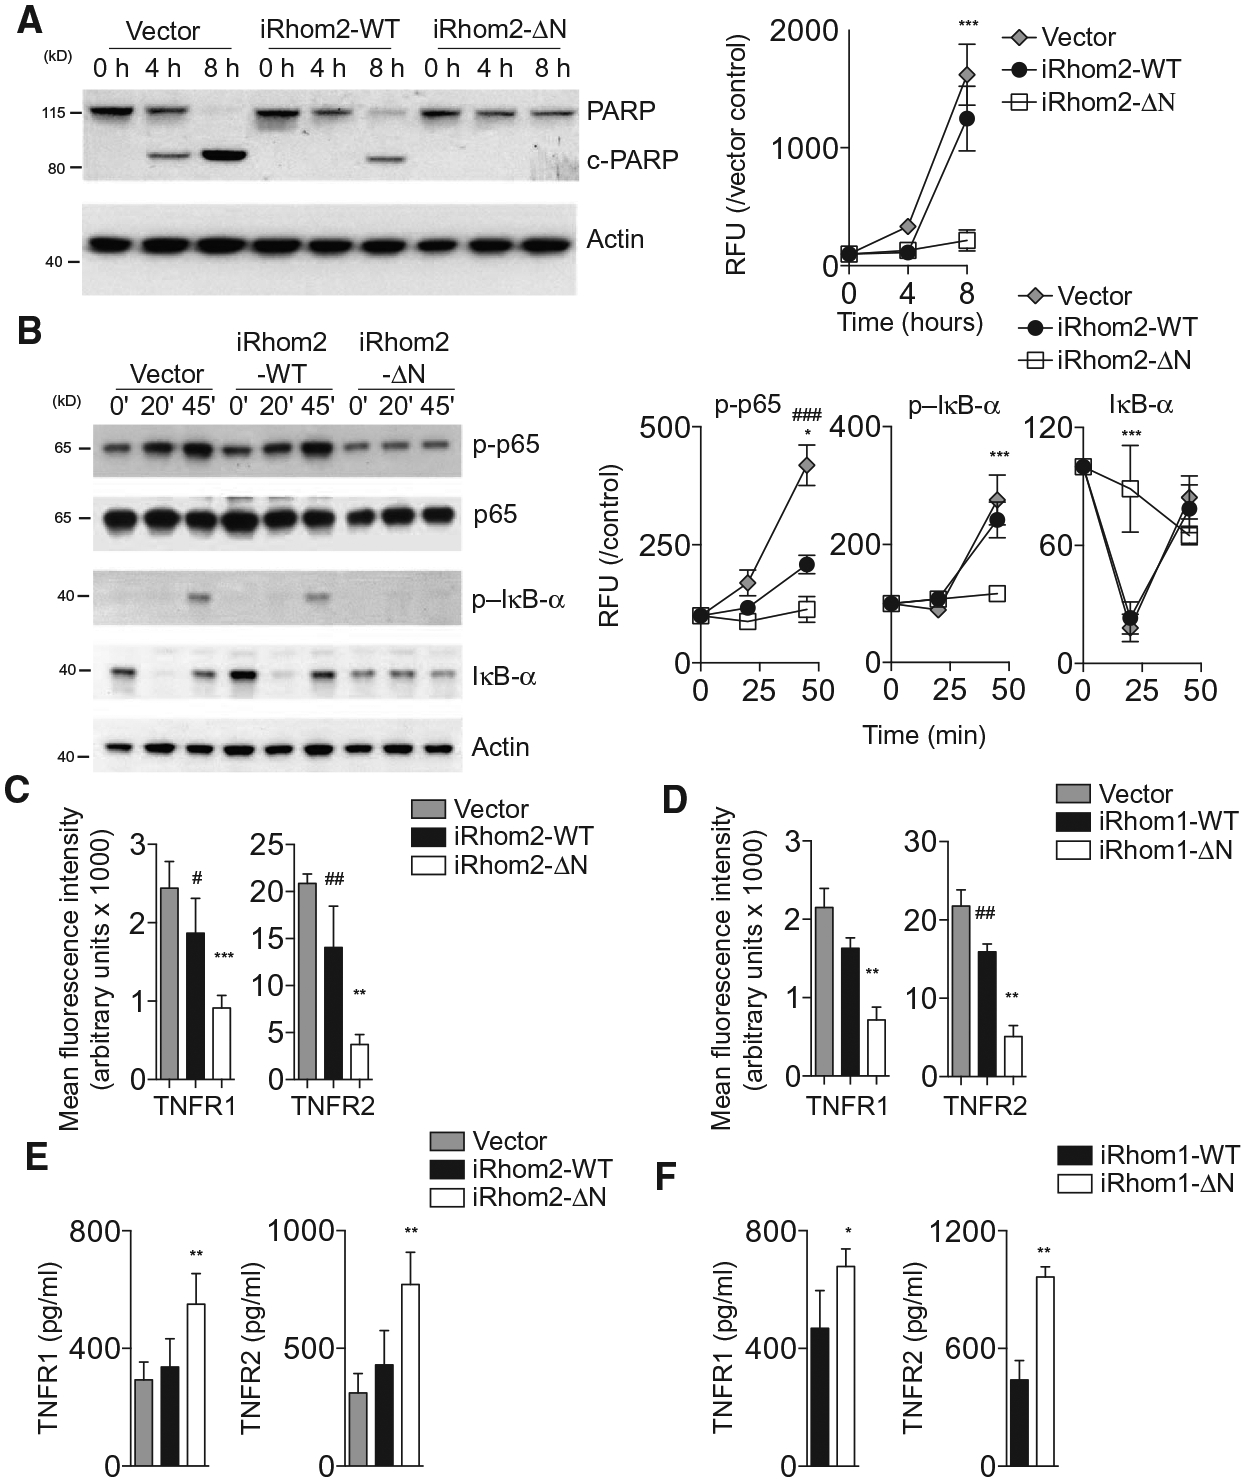
Fig. 2. iRhom2-ΔN induces TNFR shedding.

(A and B) Immunoblotting and densitometry for PARP (A) or total and phosphorylated NF-κB pathway proteins (B) in lysates from L-929 cells overexpressing a vector control, iRhom2-WT, or iRhom2-ΔN and exposed to recombinant TNF (2.5 ng/ml) for up to 8 hours (A) or 45 min (B) (n = 3, normalized to control and actin). (C and D) Flow cytometry analysis of TNFR1 and TNFR2 surface abundance on L-929 cells overexpressing WT or truncated iRhom2 (C) or iRhom1 (D) (n = 5 or 6, respectively). (E and F) Amount of TNFR1 and TNFR2 in supernatants from 1 × 10⁵ L-929 cells expressing WT or truncated iRhom2 (E) or iRhom1 (F) (n = 5). Data are means ± SEM from the number of experiments (n) indicated; *P < 0.05, **P < 0.01, ***P < 0.001 against ΔN; #P < 0.05, ##P < 0.01, ###P < 0.001 against vector. RFU, relative fluorescence units.
