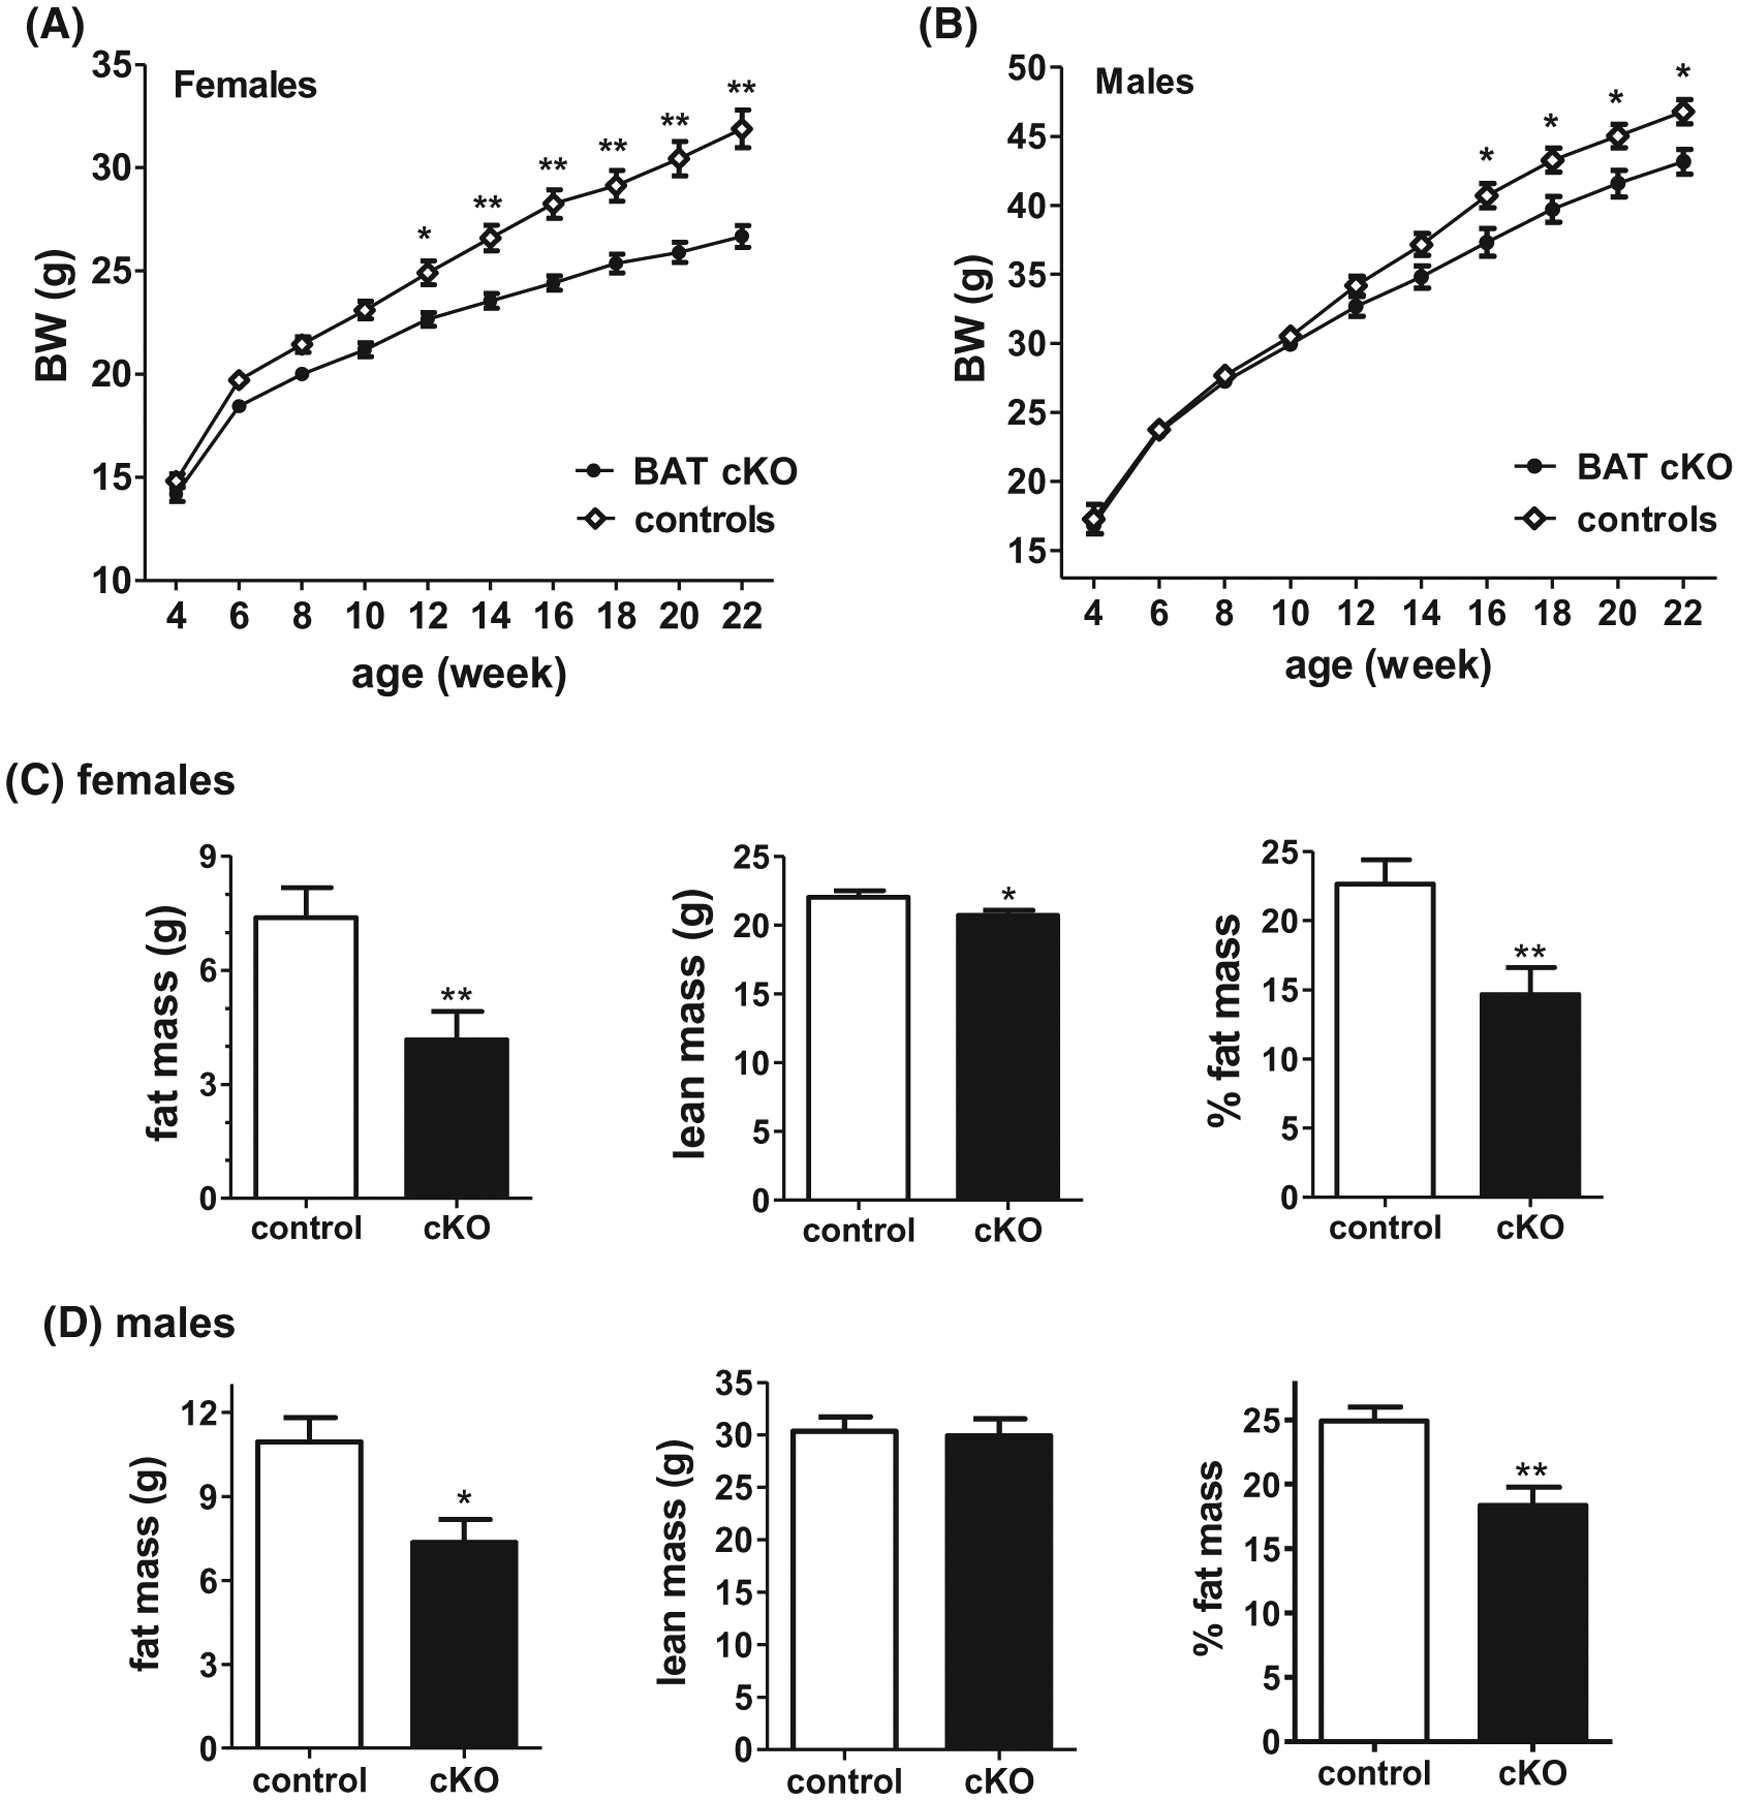
FIGURE 6.

BW of adult BAT cKO mice is decreased compared to control littermates in both A, females (n = 31–40/group) and B, males (n = 21–25/group). C and D, Mean body composition (fat mass, lean mass, and % fat mass) is also altered in BAT cKO females (n = 14/group) and males (n = 5–7/group), respectively, as measured by EchoMRI. *P < .05; **P < .01
