FIGURE 7.

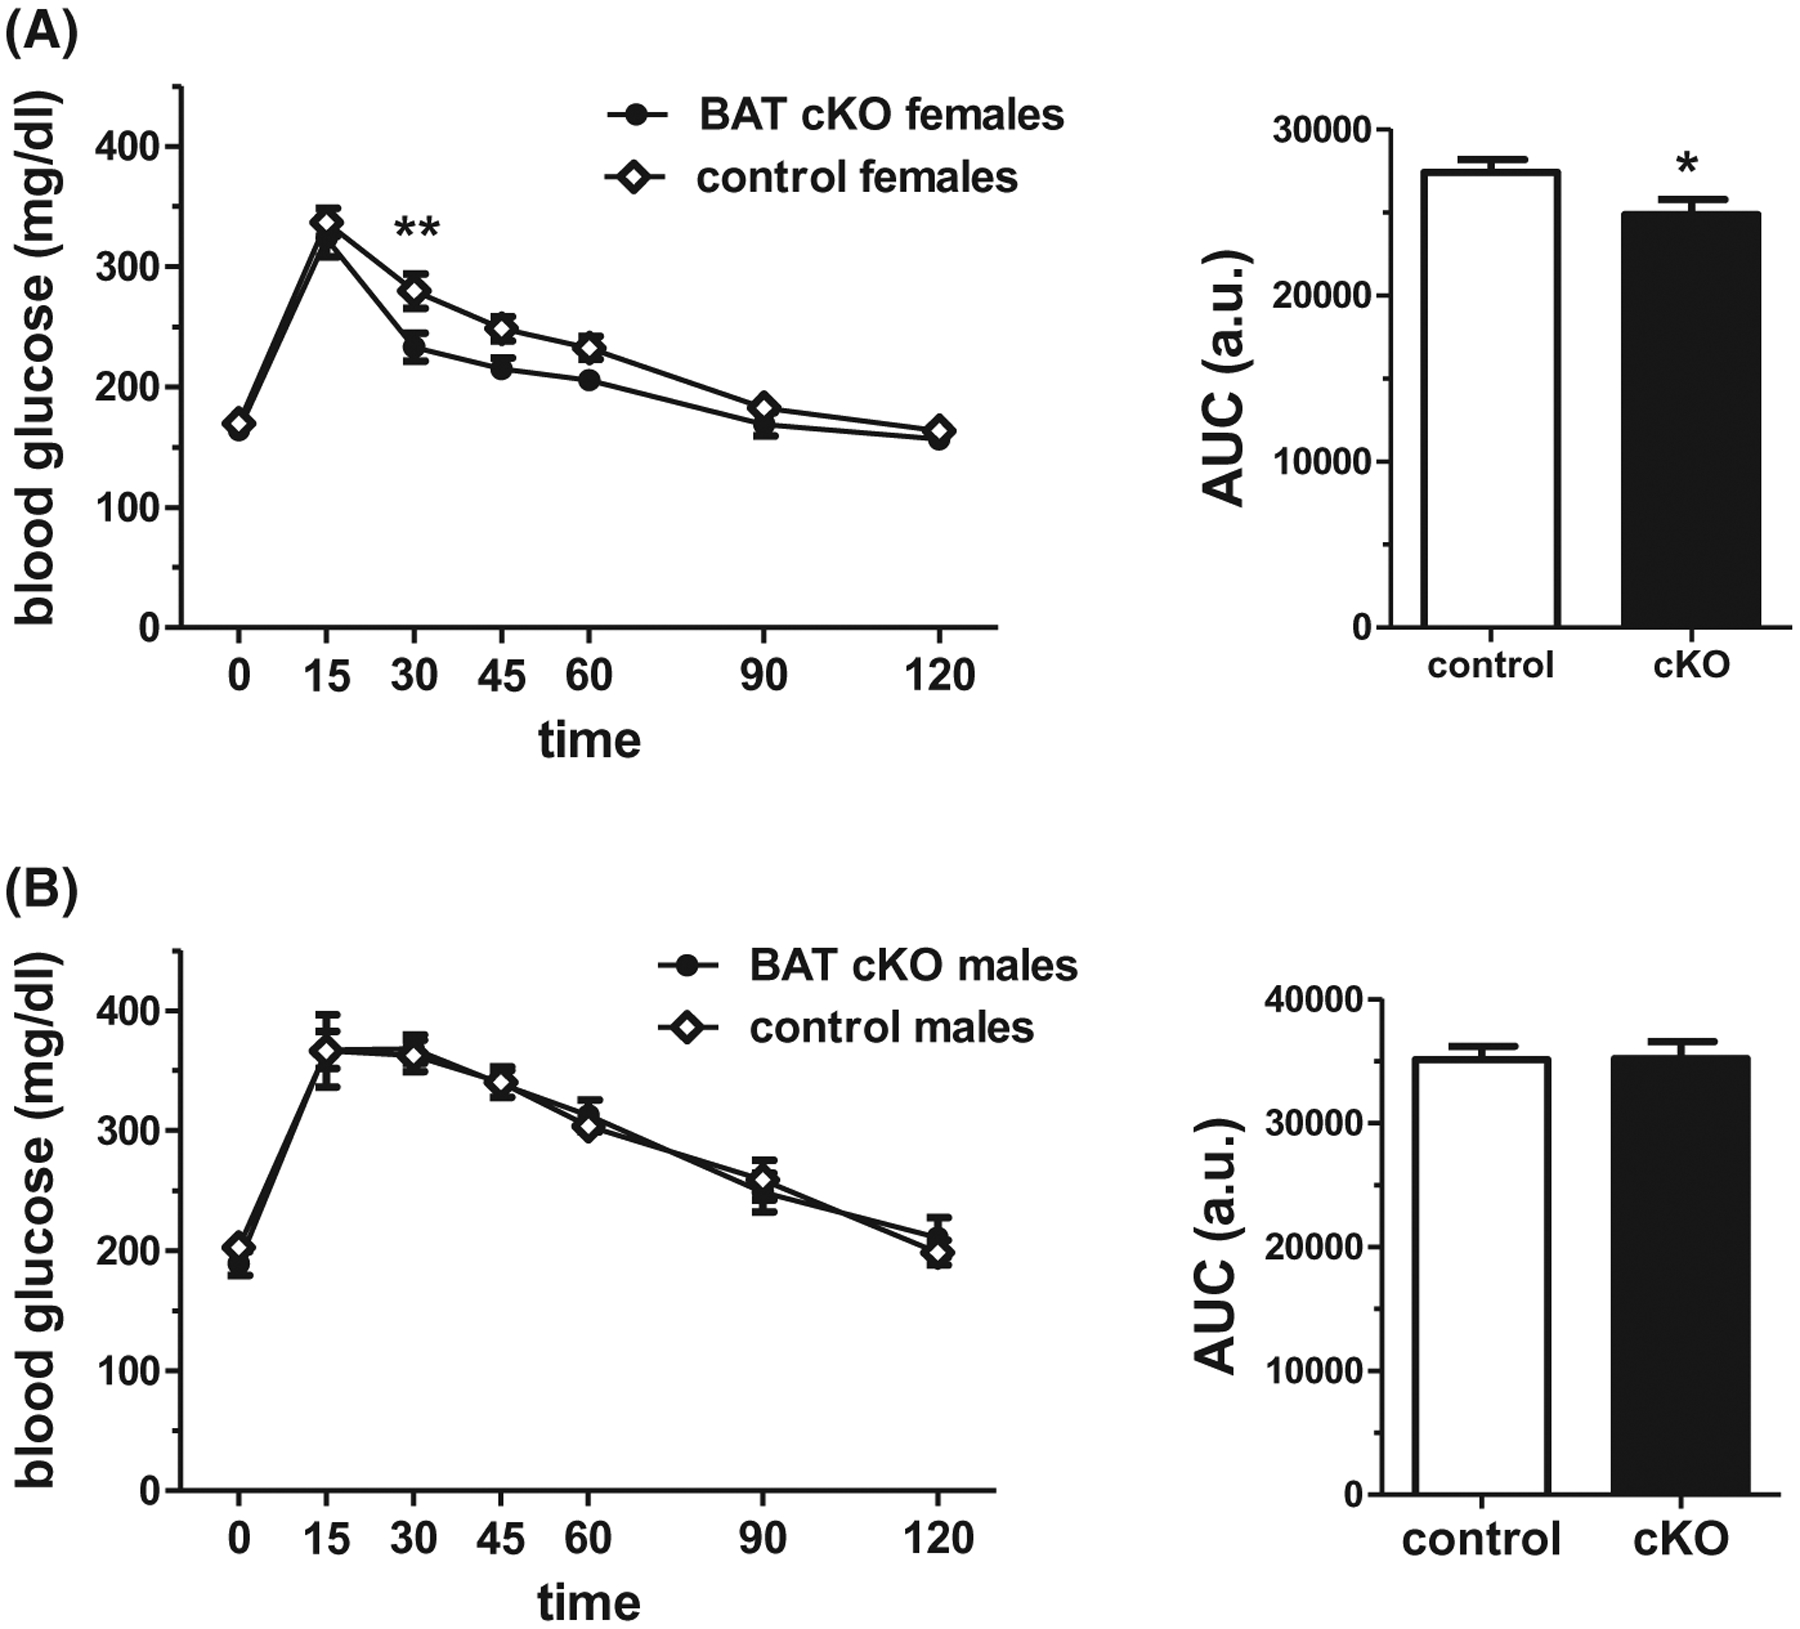
A, BAT cKO females show moderately improved glucose tolerance in an ip glucose tolerance test (GTT) (n = 14/group). B, Male BAT cKO mice show normal GTT responses compared to control males (n = 6–10/group). *P < .05, **P < .01

A, BAT cKO females show moderately improved glucose tolerance in an ip glucose tolerance test (GTT) (n = 14/group). B, Male BAT cKO mice show normal GTT responses compared to control males (n = 6–10/group). *P < .05, **P < .01