Figure 1.
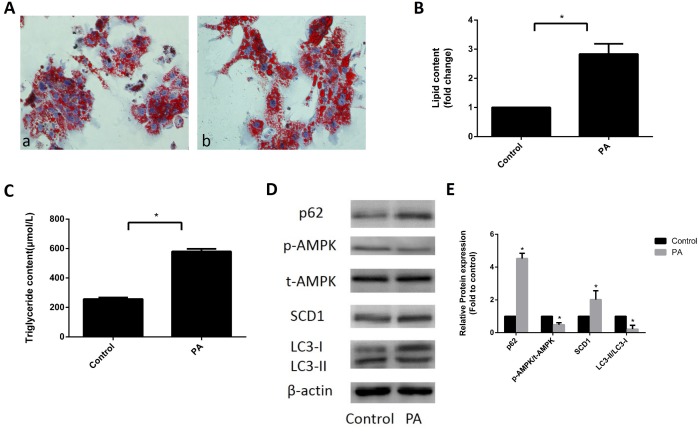
Expression of SCD1 and activation of AMPK and lipophagy in sodium palmitate-treated primary hepatocytes. (A) Primary hepatocytes were stained with Oil Red O and observed under an optical microscope. a, control group; b, PA group. (B) The intracellular lipid content in each group was quantified. (C) TG levels were measured with an enzymatic assay kit. (D, E) Protein levels were determined by Western blotting. The data are presented as the means±SDs. *p < 0.05 versus control.

