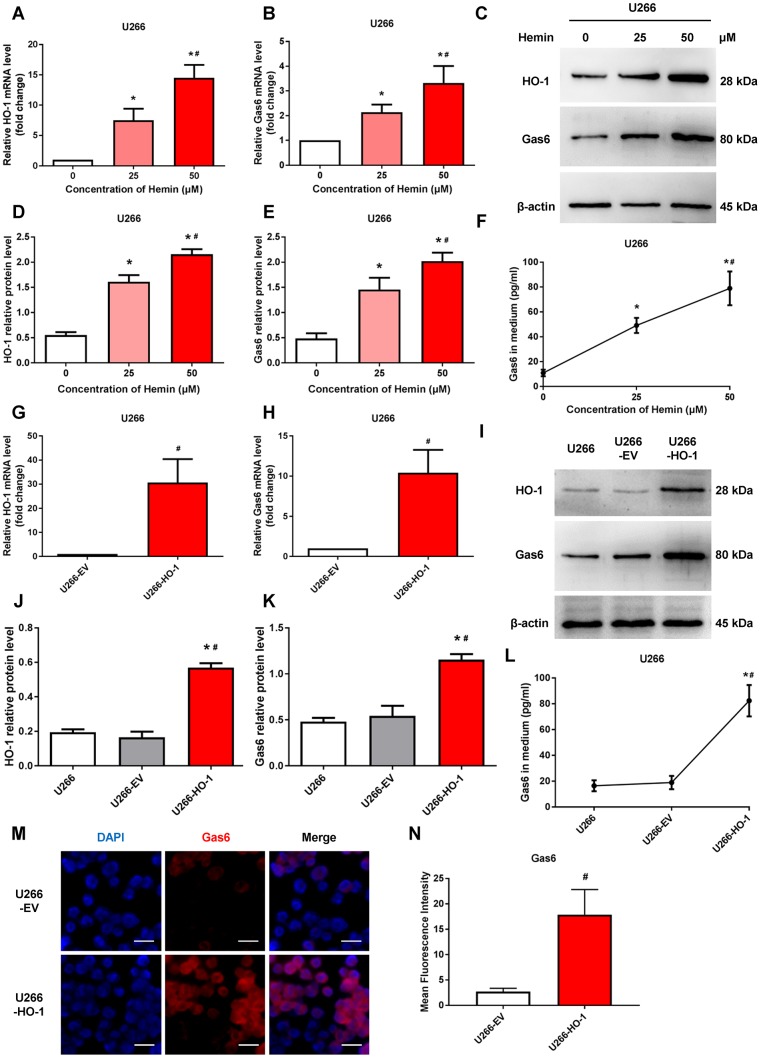
Figure 3.
HO-1 increases Gas6 expression in U266 cells. (A, B) mRNA expression of HO-1 and Gas6 in U266 cells were measured by qRT-PCR. β-actin was used as a control. Cells were treated with the indicated doses of hemin for 24 h. (C–E) Western blot and semi-quantitative analysis of HO-1 and Gas6 protein levels in U266 cells-treated with hemin for 24 h. β-actin was used as a loading control. (F) Gas6 protein in culture supernatants from U266 cells were quantified by Gas6 ELISA. Data are expressed as mean ± SD (n = 4). *P < 0.05 vs. untreated control group (0 μM); #P < 0.05 vs. low hemin group (=25 μM). (G, H) HO-1 and Gas6 mRNA levels in U266 cells were measured by qRT-PCR after transfection with empty vector (EV) and HO-1 recombinant lentiviral. (I–K) Western blot analysis was performed to detect the protein expression of HO-1 and Gas6 in HO-1 overexpressing U266 cells. (L) ELISA assay showing the level of Gas6 protein in culture supernatants. (M, N) Immunofluorescence staining was performed to visualize Gas6 expression using a primary rabbit antibody against Gas6, and followed by Alexa Fluor 555-conjugated secondary antibody. The endogenous Gas6 was shown in red. Nuclei were stained with DAPI (blue). The scale bars represent 100 μm. Data are expressed as mean ± SD (n = 4). *P < 0.05 vs. U266 group; #P < 0.05 vs. U266-EV group.

