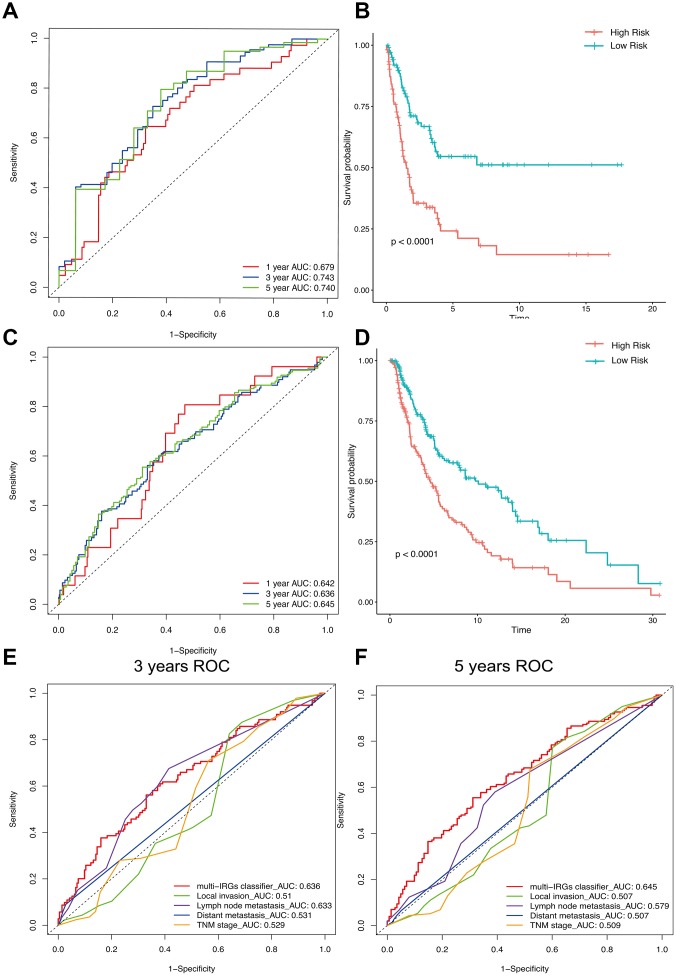
Figure 5.
The distribution of time-dependent ROC curves and Kaplan-Meier survival based on the integrated classifier in the training and independent validation sets. ROC, receiver operator characteristic. AUC, the area under the curve. (A) ROC curve for the GSE cohort. (B) KM curve of the GSE cohort. (C) ROC curve of the TCGA cohort. (D) KM curve of the TCGA cohort. (E) 3-years correlation ROC curve in the TCGA cohort for the comparison of the classifier prognostic accuracy and clinical characteristics. (F) 5-years correlation ROC curve in the TCGA cohort for the comparison of the classifier prognostic accuracy and clinical characteristics.

