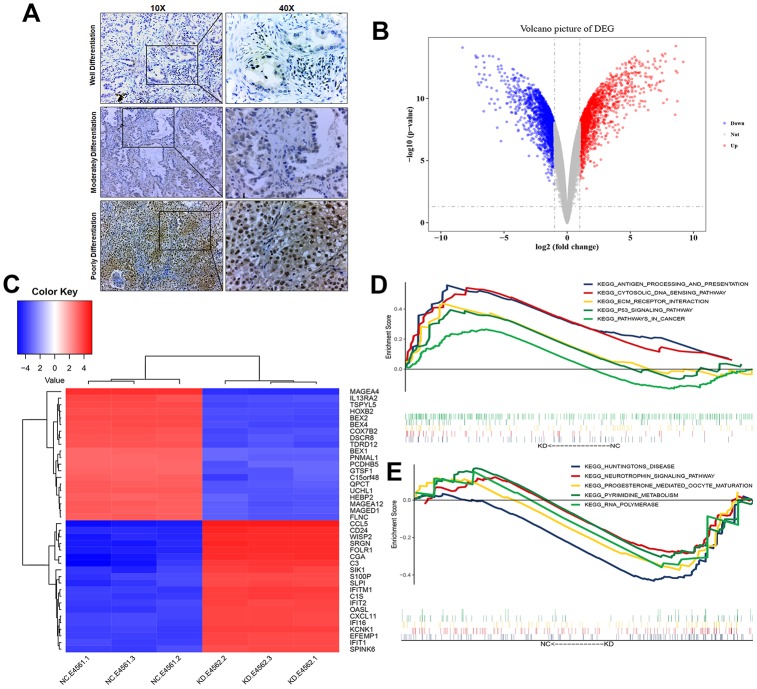
Figure 2.
Transcriptional changes of LUAD H1975 cell line induced by knockdown of USP22. (A) Detection of USP22 by immunohistochemistry. (B) Differentially expressed genes in USP22-KD H1975 cells compared to negative control. Red represents up-regulated genes, blue represents down-regulated genes, and gray represents no significantly differentially expressed genes. (C) The expression patterns of these 3806 differentially expressed genes can distinguish between USP22-KD H1975 cells and negative control. (D) Pathways significantly enriched in negative control H1975 cells. (E) Pathways significantly enriched in USP22-KD H1975 cells.

