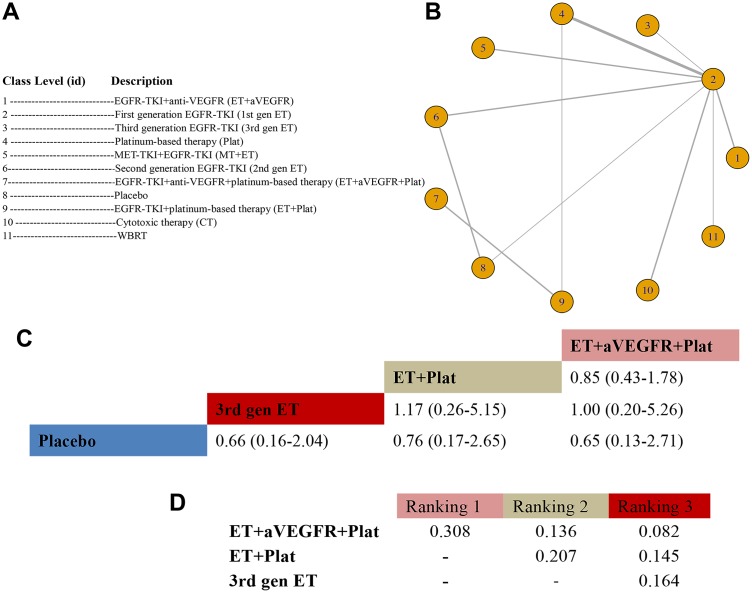
Figure 4.
Meta-analysis of efficacy for OS at the medication-class level. (A) Descriptions of the medication classes included in this analysis. (B) Network plots showing comparisons between nodes (yellow circles), each representing a unique medication class. Each line corresponds to direct comparisons between treatments, with the width corresponding to the number of direct within-trial comparisons. (C) Comparison results of the most efficacious class and placebo (HR (95% CrI)). Each result is a comparison between the column-defining drug and the row-defining class. (D) Schematic detailing the most efficacious medication classes according to the rankograms.

