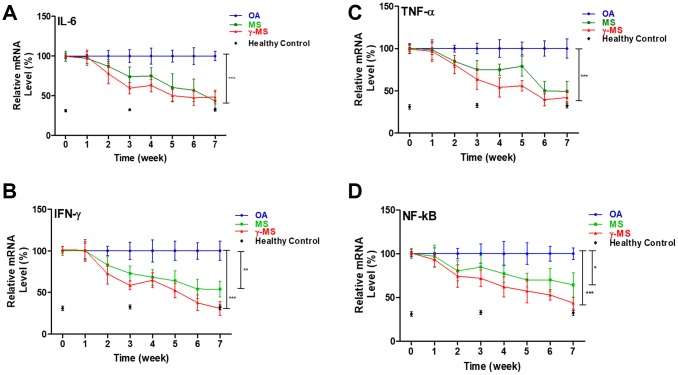
Figure 2.
Longitudinal qPCR analysis of serum inflammatory markers of OA. (A–D) Relative ratio of mRNA expression of IL-6, TNF-a, IFN-γ and NF-κb between OA control; MS and γ-MS treated mice and healthy control. Three-time points (black diamonds) at week 0, 3 and 7 represent the relative mRNA level from the healthy control mice. *P<0.05; **P<0.01; ***P<0.005.

