Figure 1.
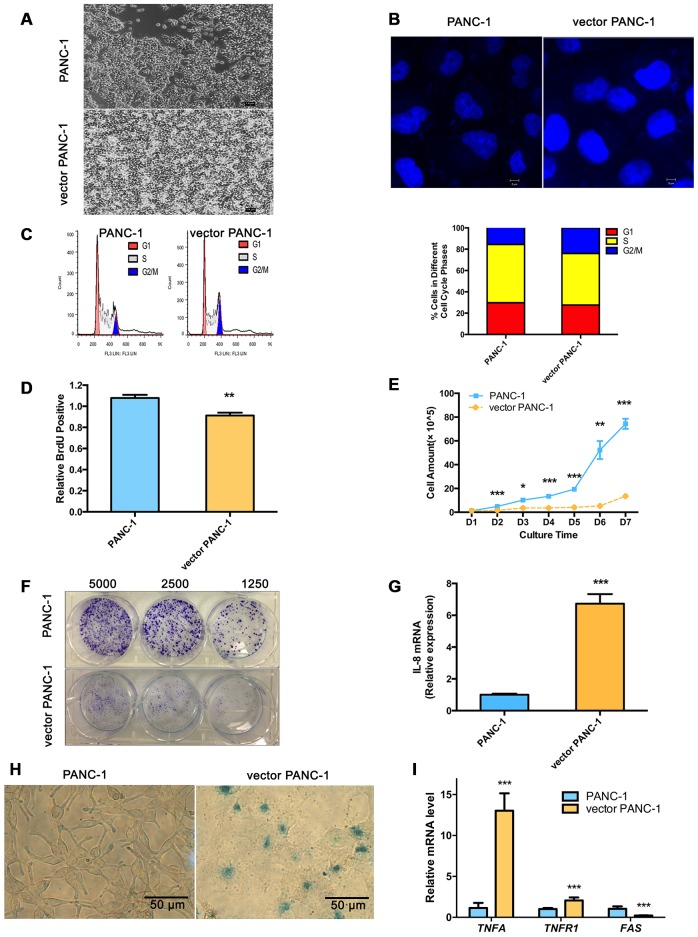
Stable transfection-induced PANC-1 cell senescence. (A) Morphology graph of vector PANC-1 cells. (B) Confocal fluorescent graph of the nuclei (blue fluorescence) morphology of vector PANC-1 cells. (C) An increased percentage of vector PANC-1 cells was arrested in G2/M phase. Graphic (top) and percentage (bottom) representations of cell cycle distributions are shown. This experiment was repeated independently three times. (D) Decreased BrdU incorporation during DNA synthesis in vector PANC-1 cells. Data are presented as the mean ± S.E.M, n = 4 (**p < 0.01). (E) Cell growth curve shows decreased proliferation of vector PANC-1 cells. Data are presented as the mean ± S.E.M, n = 3 (*p < 0.05, **p < 0.01, ***p < 0.001). (F) Decreased ability of vector PANC-1 cells to form colonies when seeded at the indicated dilutions. (G) Quantitative RT-PCR analysis of the upregulated key SASP factor, IL-8 mRNA, in vector PANC-1 cells. Data are presented as the mean ± S.E.M, n = 3 (***p < 0.001). (H) SA-β-gal staining and positive senescence signal of vector PANC-1 cells. This experiment was repeated independently three times. (I) Activation of extrinsic apoptosis pathways was analyzed. See also Supplementary Figures 1 and 2.

