Figure 4.
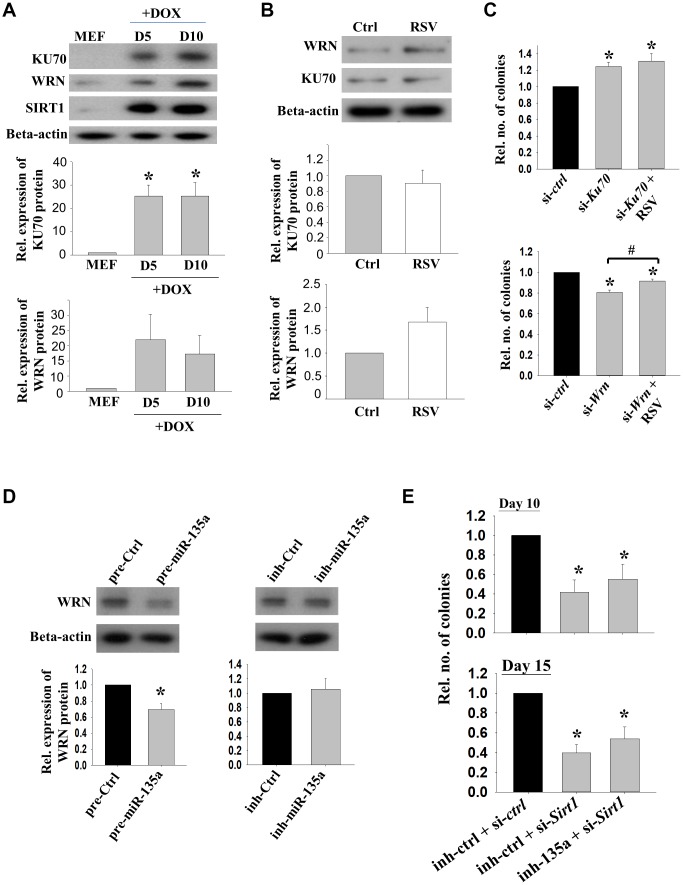
The effects of KU70 and WRN on reprogramming efficiencies. (A) The relative protein expressions of KU70, WRN and SIRT1 in reprogramming MEFs on D5 and D10 upon DOX treatment. (n=3; *: p<0.05 when compared with MEFs; one way ANOVA). (B) The relative protein expression levels of KU70 and WRN in 2°F MEFs without (Ctrl) or with (RSV) RSV treatment after DOX induction. (C) The relative number of colonies formed after transfection with Ku70 (si-Ku70) or Wrn (si-Wrn) siRNA with or without the addition of RSV during the reprogramming. (n=3; *: p<0.05 as compared to siRNA control (si-ctrl); #: p<0.05 when compared with or without the addition of RSV; one way ANOVA). (D) The relative protein expressions of WRN in 1° MEFs after transfecting with miR-135a precursor (pre-135a) or inhibitor (inh-135a) for 72h (n=4; *:p<0.05; t-test). (E) The relative number of colonies formed after co-transfection with miR-135a inhibitor (inh-135a) and Sirt1 siRNA (si-Sirt1) during the reprogramming. (n=6; *: p<0.05 as compared to co-transfection with miRNA inhibitor control (inh-ctrl) and siRNA control (si-ctrl); one way ANOVA).

