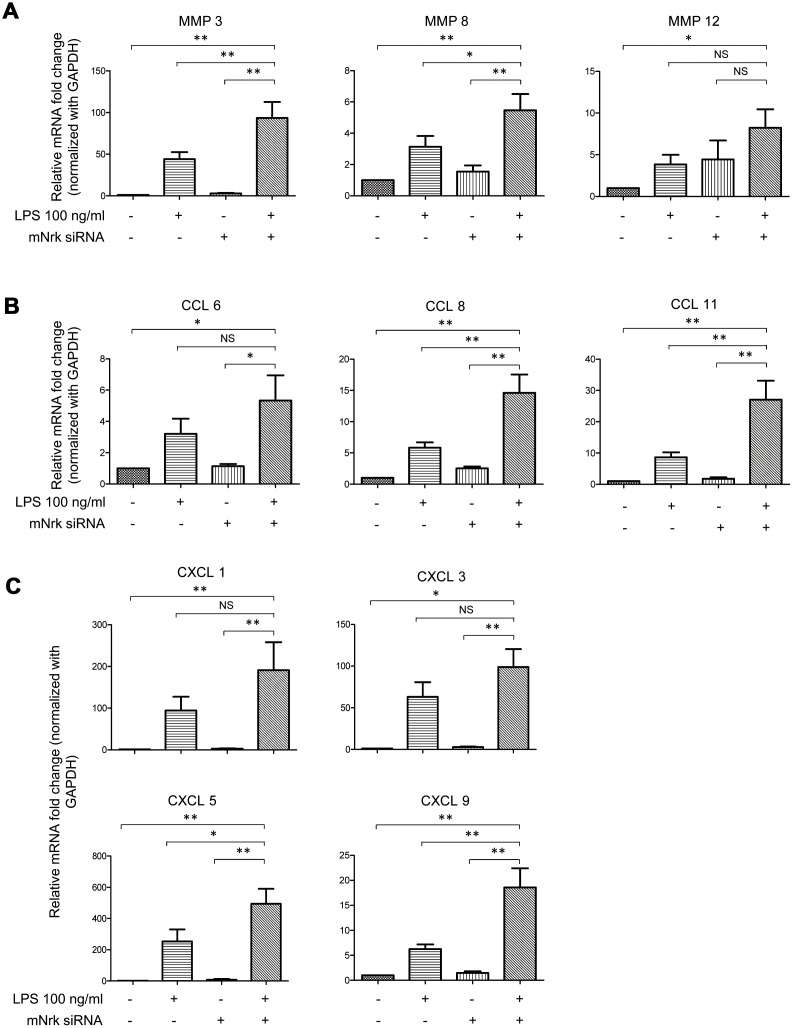
Figure 5.
Expression of MMPs and chemokines in LPS- and Nrk-siRNA treated mVSMCs. mVSMCs were serum starved (0.5% FBS in DMEM) for 24 h and then treated with LPS (100 ng/mL) for 24 h. Cells were further transfected with 20 nM of negative control or mNrk siRNA for an additional 48 h. Expression of (A) MMP3 (n=13), MMP8 (n=13) and MMP12 (n=14); (B) CCL6 (n=14), CCL8 (n=14) and CCL11 (n=14); (C) CXCL1 (n=14), CXCL3 (n=11), CXCL5 (n=10) and CXCL9 (n=13) was determined by qPCR. Gene expression results of qPCR analysis were normalized to both control cells as well as GAPDH. Scale bars: means ± SD. *, p < 0.05, **, p < 0.01, ***, p < 0.001.

