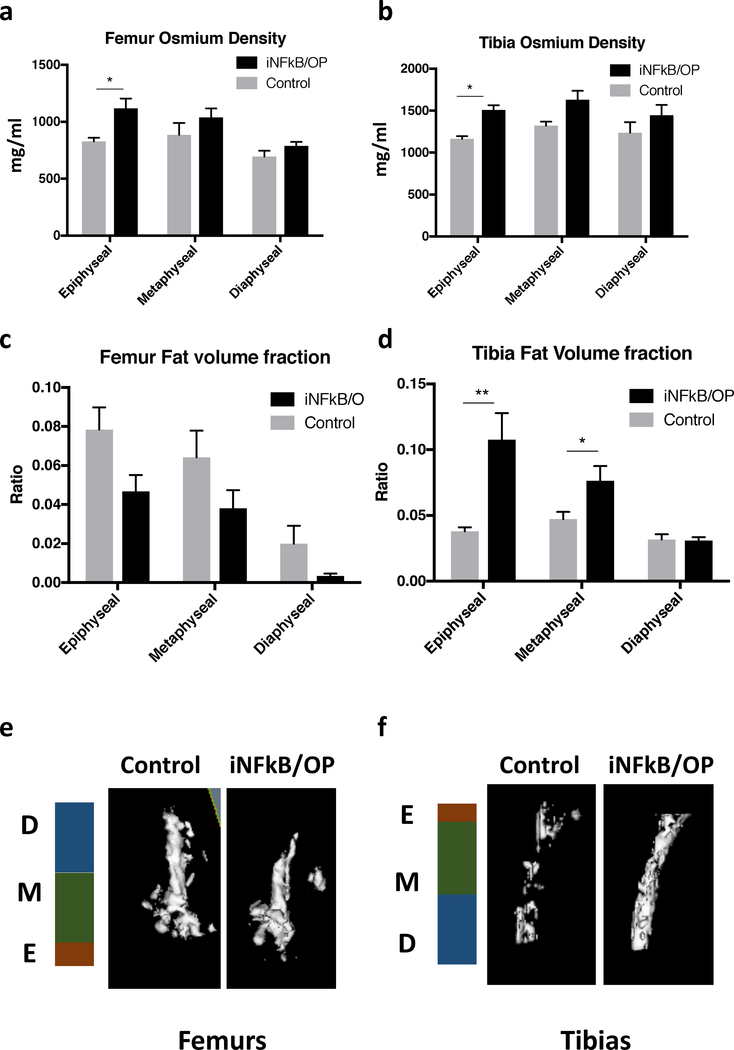
Fig.4. Quantification of bone marrow fat stained with osmium.
The osmium-stained bone marrow fat scanned by μCT. The osmium density (a & b) and fat volume fraction (c & d) in femurs and tibias at the epiphysis (4×4×1mm3), metaphysis (4×4×3 mm3), and diaphysis (4×4×3 mm3) regions in iNF-kB/OP transgenic (n=6) and control mice (n=6) were quantified. The 3D reconstructed images of osmium-stained bone marrow fat in femurs (e) and tibias (f) were generated. E: epiphysis; M: metaphysis; D: diaphysis*p<0.05, **p<0.01

