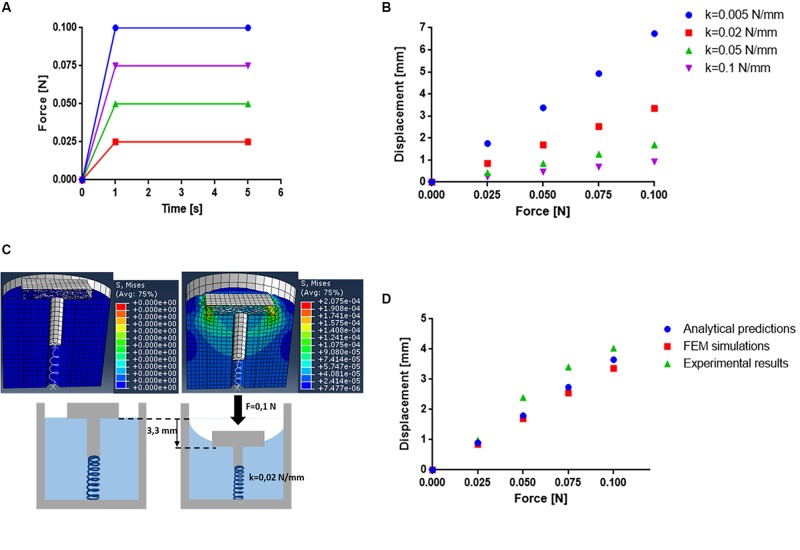
FIGURE 3.
(A) Forces applied on the sliding top during the simulation on Abaqus. (B) Results obtained from FEM simulations in terms of displacement of the sliding top following the application of 4 different forces (0.025, 0.05, 0.075, and 0.1 N) and with 4 different spring’s stiffness (0.005, 0.02, 0.05, and 0.1 N/mm). (C) Frames of the simulation on Abaqus with values of pressures exerted on the top. (D) Graphs of the force applied on the sliding top of the device in function of its displacement: analytical results (blue), simulation results (red) and compression tests results (green) (n = 10).

