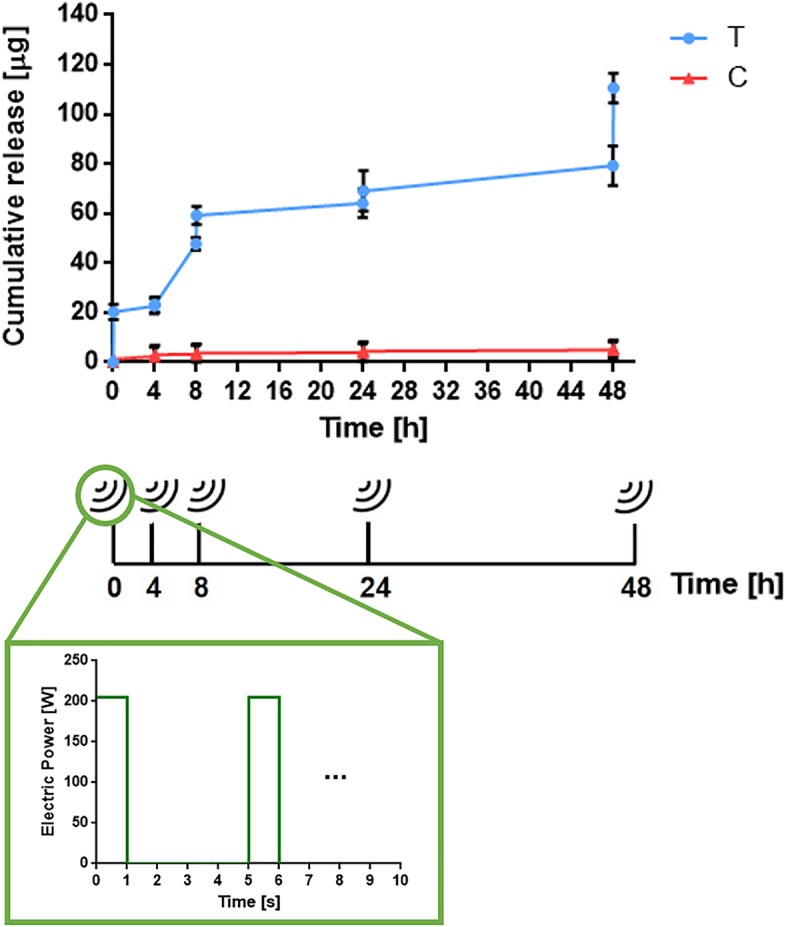
FIGURE 7.

Example of the cumulative drug release from a device triggered by the acoustic radiation force (blue curve) respect to control (non-stimulated) samples (red curve) (n = 3). Bottom image shows the stimulation wave applied on the device (p = 205 W and DC = 20%). Each pulse series is applied for 3 min.
