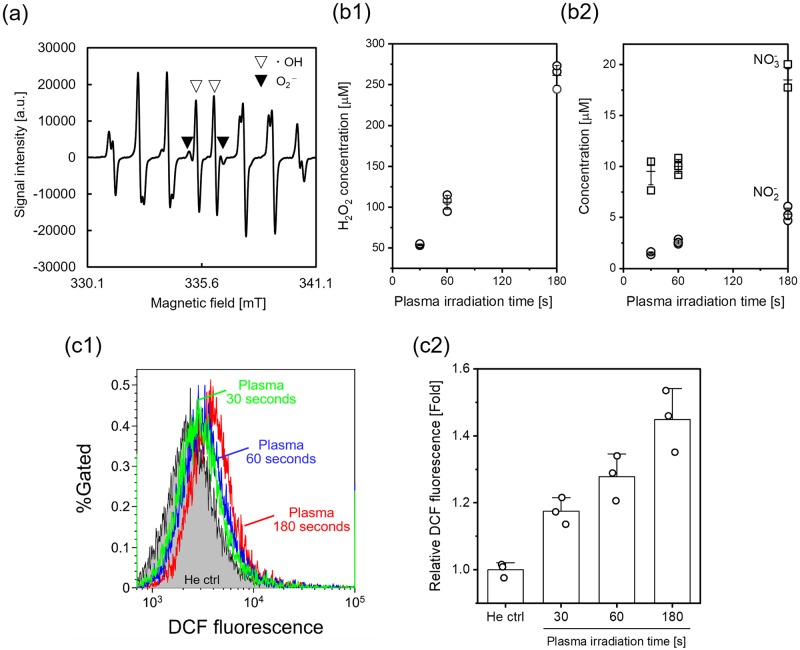
Fig 2. RONS production in the plasma-irradiated liquid and cells.
(a) ESR spectrum of the plasma-irradiated CYPMPO solution. The plasma irradiation time was 180 seconds. The spin adduct signals of the OH radical and superoxide can be distinguished by the peaks in the central part; the solid triangle markers indicate the superoxide adduct, and the open triangles indicate the OH adduct. One milliliter of 10 mM CYPMPO in D-PBS (−) was added to one well of a 24-well tissue culture test plate before exposure to the helium plasma jet. (b) Concentration of (b1) H2O2 and (b2) NO2− and NO3− in plasma-irradiated D-PBS (−). Data are expressed as the mean±standard deviation (SD) of triplicate measurements. (c) Intracellular RONS production in the plasma-irradiated A549 cells. A549 cells were treated with the He plasma jet for 30, 60 and 180 seconds, and then RONS production was detected with flow cytometry using CM-H2DCFDA. (c1) Typical flow cytometry histograms and (c2) median fluorescence intensity normalized to the He ctrl. “He ctrl” indicates a control experiment, in which the cell suspension was exposed to He gas flow for 180 seconds. Data are expressed as the mean±SD of triplicate measurements. Statistical significance was recognized at p = 0.0026 for 30 seconds, p = 0.00246 for 60 seconds, and p = 0.00122 for 180 seconds vs. the He ctrl as determined with the Student’s t-test.

