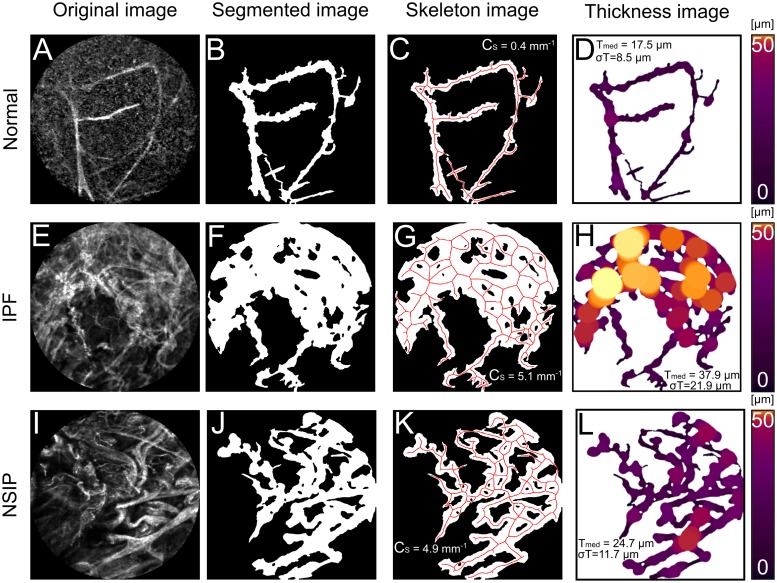
Fig 2. Three examples from every step of evaluation workflow.
A-D) represent normal alveoli elastin structure with Tmed = 17.5 μm, σT = 8.5 μm and Cs = 0.4 mm−1, E-H) represents IPF elastin structure with Tmed = 37.8 μm, σT = 21.9 μm and Cs = 5.1 mm−1. I-L) represents NSIP structure with Tmed = 24.7 μm, σT = 11.7 and Cs = 4.9 mm−1.

