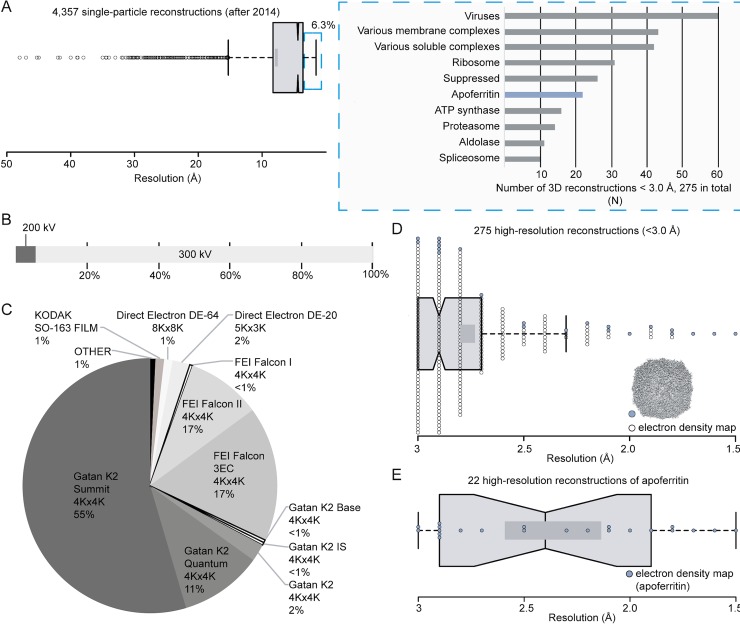
Fig 1. Analysis of single-particle cryo-EM structures from EMDB.
(A) On the left, box plot shows the distribution of resolution in all single-particle reconstructions after 2014 and on the right, a bar plot shows the type of specimen reaching resolution better than 3.0 Å; (B) Percentage of structures reaching resolution better than 3.0 Å according to the electron microscope accelerating voltage used to acquire micrographs; (C) A pie chart showing the detector types applied for deriving molecular structures better than 3.0 Å; (D) A box plot showing the distribution of resolution for structures better than 3.0 Å; apoferritin reconstructions are highlighted in blue; (E) A box plot showing the distribution of resolution for apoferritin reconstructions. Dark grey rectangles in (D) and (E) show the confidence intervals at 83%; middle black line shows the average. Data points are shown with circles.

