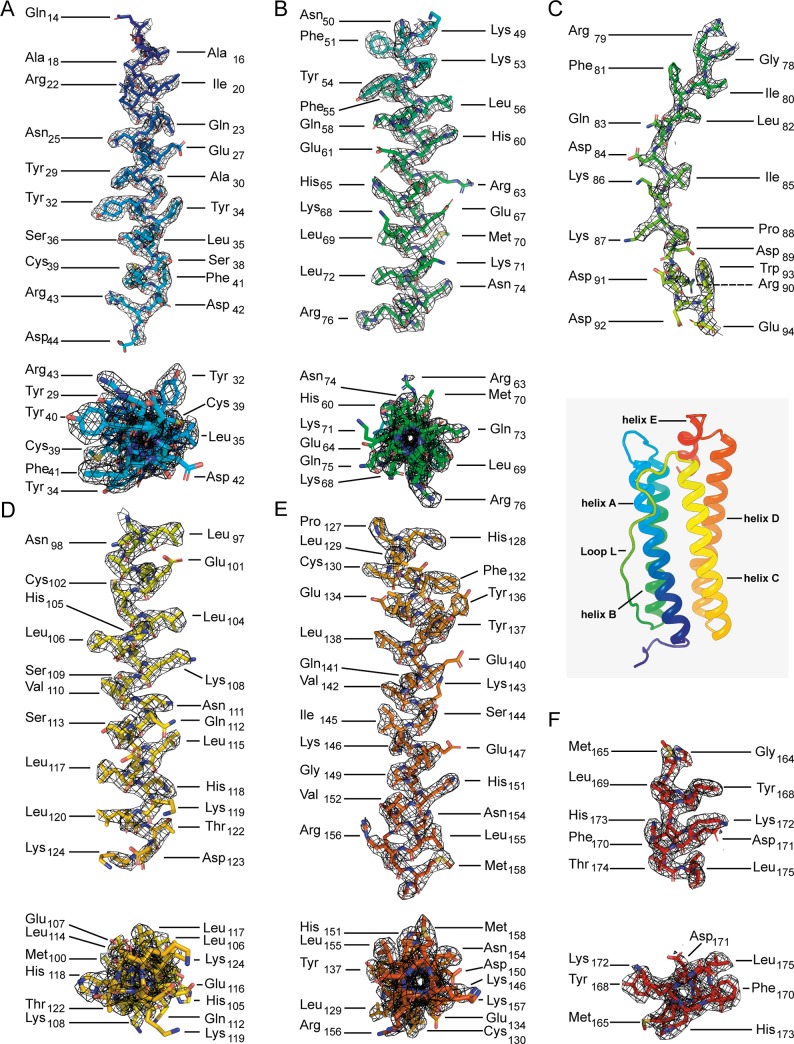
Fig 4. Coulomb potential densities for each secondary structure element of the apoferritin monomer (insert), with individual amino acid residues shown in stick representation.
(A, B, D-F) helices A-E are shown with the fitted model and the corresponding density perpendicular to (top panels) and along (bottom panels) the helix axes. (C) Density and fitted model for loop L.

