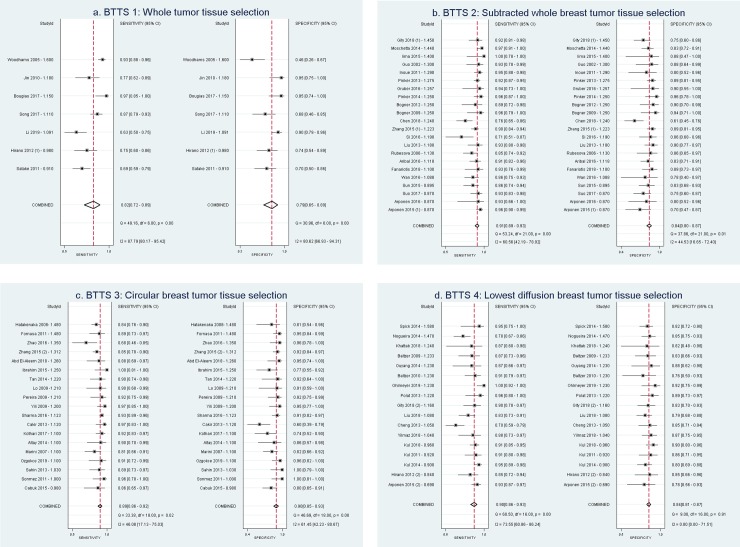
Fig 2. Forest plots for each BTTS method, showing sensitivity and specificity with confidence intervals of each study subset and in the last row the pooled values (diamond).
Study subsets are sorted by ADC threshold. Study ID = Author—ADC threshold (10–3 mm2/s). a) BTTS1: Whole breast tumor tissue selection, b) BTTS2: Subtracted whole breast tumor tissue selection, c) BTTS3: Circular breast tumor tissue selection, d) BTTS4: Lowest diffusion breast tissue selection. BTTS = breast tumor tissue selection. (1)/(2) refers to the two different BTTS method inclusions (study subsets) from the same study.

