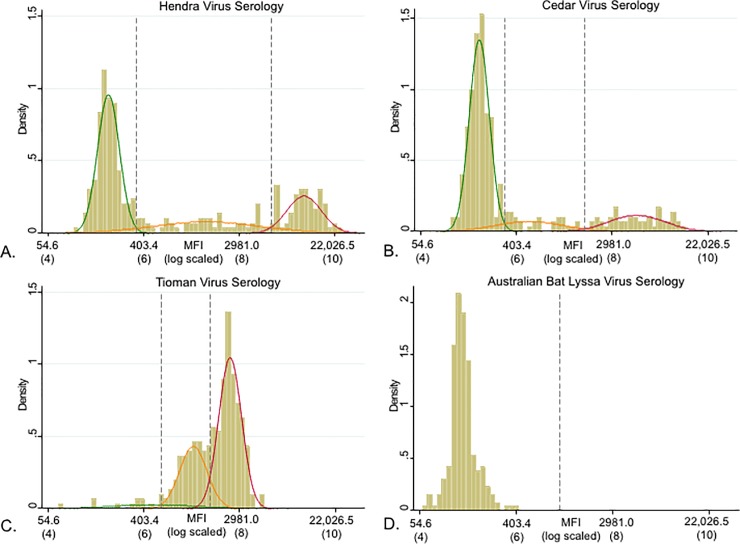
Fig 2. Density histogram and overlaid mixture of modelled distributions.
Density histogram and overlaid mixture of modelled distributions for MFI and the natural log MFI of A) Hendra virus, B) Cedar virus, C) Tioman virus and D) Australian bat lyssavirus serological readings. Thresholds (dashed vertical lines) correspond to the intersection between a pair of predicted distributions. Upper and lower thresholds for the Hendra virus serology were determined as the natural antilogorithm of 5.85 and 8.67, respectively (MFI 347 and 5,825, respectively). Upper and lower thresholds for the Cedar virus serology was determined as the natural antilogorithm of 5.76 and 7.44 respectively (MFI 317 and 1,702 respectively). Upper and lower thresholds for the Tioman virus serology was determined as the natural antilogorithm of 6.37 and 7.38 respectively (MFI 584 and 1,603 respectively). Upper and lower thresholds could not be calculated for Australian bat lyssavirus as it was determined that all animals belong to the same exposure sub-population.

