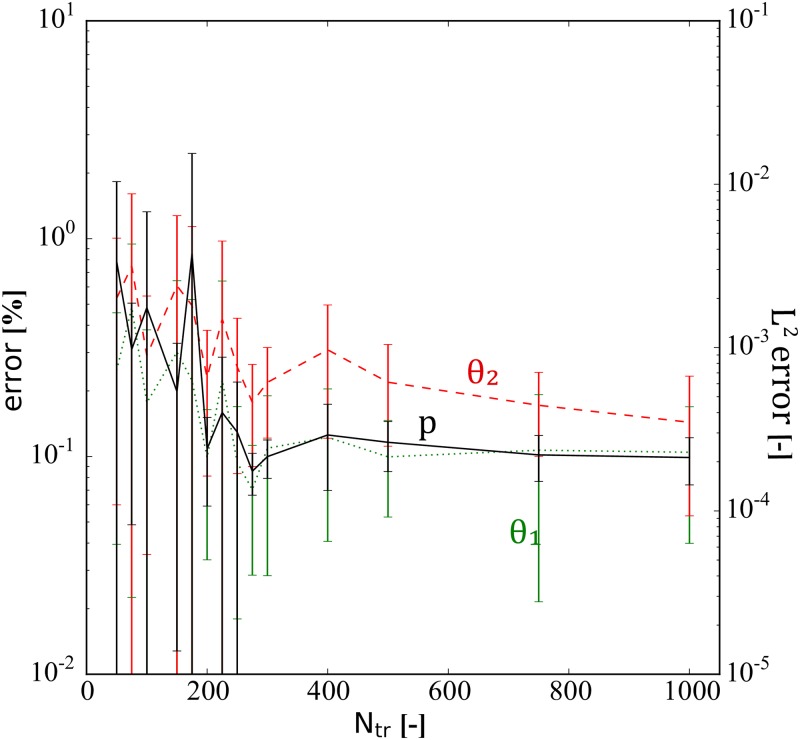
Fig 6. Diffusivity equation—inverse modeling: PINN performance as function of training set size.
This figure shows the estimated error dependency on the amount of training data, Ntr. The error bars show mean and standard derivation (± 1 SD) based on 24 realizations. Note that there is no noise added in this investigation, and all physical constants are set to one, i.e., θ1 = θ2 = 1.0. The reported error values of θ1 and θ2 are percentage errors while the relative error is shown for p.

