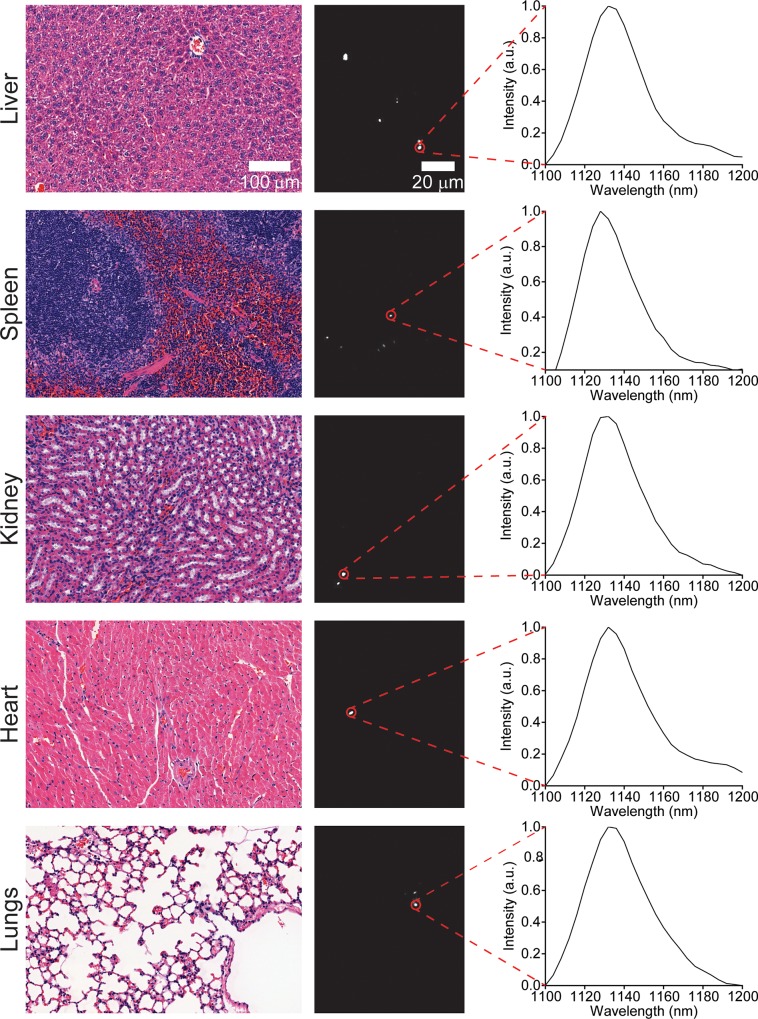
Fig 3. Imaging carbon nanotubes in murine tissues one month after injection.
H&E stains (left) and hyperspectral microscopy images (middle) of various organs one month after intravenous injection with ssCTTC3TTC-(9,4) complexes. Representative fluorescence spectra (right) of the denoted complexes are shown.

