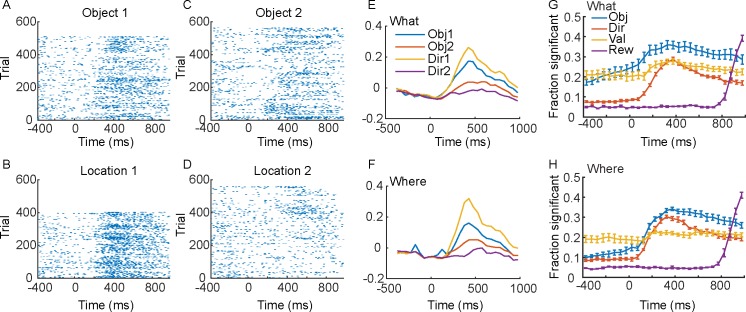
Fig 2. Single cell example and single cell population statistics.
Time 0 is cue onset. Rasters and spike density functions for the example neuron are in panels A-F. A. Responses to choosing Object 1 in the What condition. B. Responses to direction/location 1 in the Where condition. C. Responses to choosing Object 2 in the What condition. D. Responses to choosing direction/location 2 in the Where condition. E. Average responses for the single neuron shown in A-D in the What condition. Average of the spike density functions for the preferred (Obj 1) vs. non-preferred (Obj 2) objects, or direction 1 or 2. F. Same as E for the Where condition. G. Fraction of neurons across the population significant in an ANOVA for each factor indicated, in the What condition. H. Same as G for the Where condition. Solid lines are averages across sessions (N = 6, 3 from each animal) and error bars are s.e.m. across sessions.

