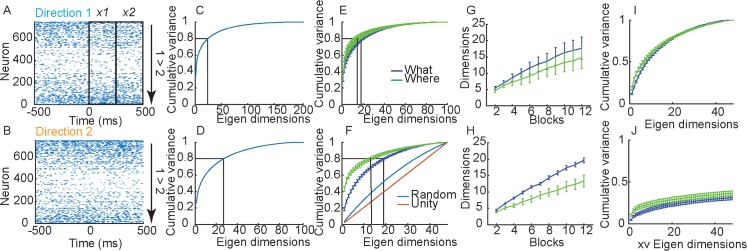
Fig 3. Single trial representations.
A. Raster showing the response of a population of simultaneously recorded neurons from a single trial when the animal chose Direction 1 in a trial from the Where condition. Outline boxes show time windows, x1 and x2, used to define activity vectors in analyses. B. Same as A for choice of Direction 2. C. Cumulative fraction of variance explained in trial-averaged responses (i.e. the vectors μi from each block and phase) across all blocks of both conditions. Note that the matrix only has 192 independent dimensions, so the cumulative variance saturates at 1 in dimension 192. D. Same as C for information dimensions, w = μ2 − μ1. This matrix has 96 dimensions, so cumulative variance saturates in dimension 96. E. Cumulative fraction of variance explained in trial-averaged responses (i.e. the vectors μi from each block and phase). Data is split out by What (Blue) and Where (Green) blocks. F. Same as E for informative dimensions, w. In addition, we also plot the dimensionality of a matrix with the same dimensionality, but with vectors chosen to have random directions, and also the unity line which has a constant increase in variance. G. Dimensionality of trial averaged responses as a function of number of blocks included in analysis. As we accumulate blocks in the analysis the dimensionality increases, also showing that the means do not all lie in the same subspace. The y-axis was estimated by calculating the number of dimensions required to account for 80% of the variance in the PSTHs as we aggregated randomly selected blocks. Note that the more independent (orthogonal) are the PSTHs in different blocks, the more dimensions will be required to span them as we aggregate across blocks. H. Same as G for the informative dimensions. I. Cumulative variance accounted for in informative dimensions, w, after removing the first principal component from both What and Where conditions. J. Cumulative variance accounted for with cross validation.

