Fig 4.
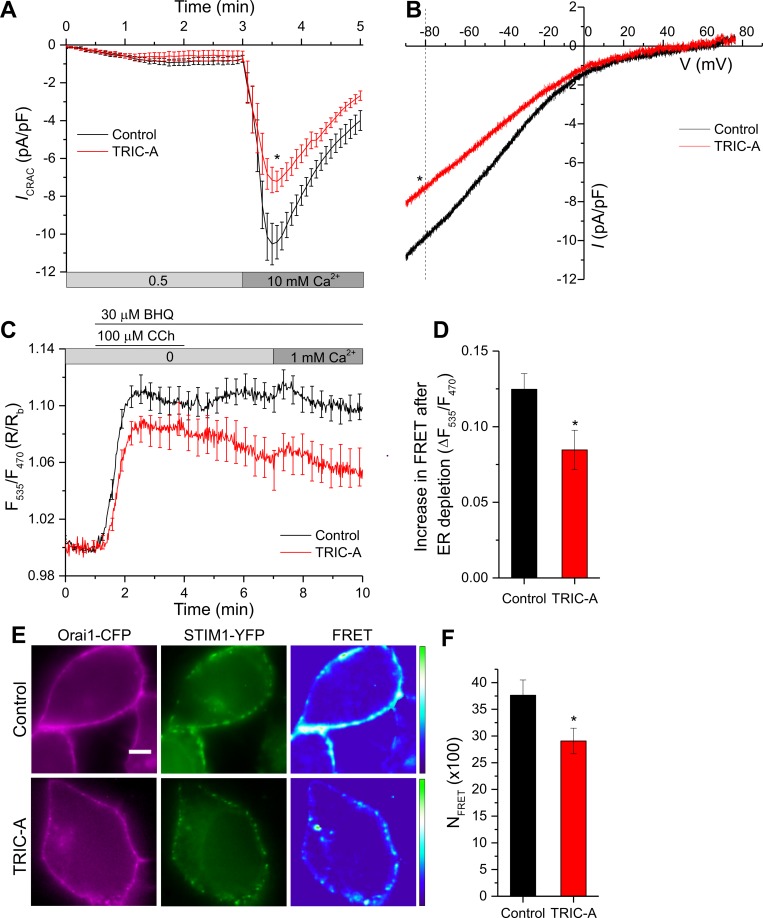
TRIC-A inhibits Orai1-mediated ICRAC (A, B) and STIM1–Orai1 interaction (C–F) upon store depletion. (A) Whole-cell voltage-clamp experiments show time course of ICRAC at −80 mV mediated by YFP-STIM1 + Orai1-CFP, coexpressed along with mCherry-ER-3 (control, n = 13) or TRIC-A-mCherry (TRIC-A, n = 11) in HEK293 cells. Current activation was mediated by ER store depletion with 10 mM EGTA in the patch pipette solution, and stepwise current increment was recorded at 0.5 and 10 mM Ca2+ in the bath solution. (B) Traces show representative peak I–V relationship in control and TRIC-A groups at 10 mM Ca2+. (C) Traces show dynamic FRET between STIM1-CFP and YFP-Orai1, co-transfected in HEK293 cells along with mCherry-ER-3 (control, n = 20) or TRIC-A-mCherry (TRIC-A, n = 13). (D) Increase in STIM1-Orai1 FRET shown in (C) upon ER depletion with 100 μM CCh + 30 μM BHQ in TRIC-A cells versus controls. (E) Representative epifluorescence images of ER-depleted (100 μM CCh + 30 μM BHQ) HEK293 cell expressing Orai1-CFP (left, magenta) + STIM1-YFP (middle, green) and corresponding FRET (right) in absence (Control, top) and presence (TRIC-A, bottom) of coexpressed TRIC-A. Scale bar = 5 μm. (F) Bars show NFRET (× 100) in TRIC-A-transfected cells (n = 15) versus controls (n = 16). *p < 0.05, mean values ± SEM are shown. Underlying data in panels (A–D) and (F) are included in S1 Data. BHQ, 2,5-Di-t-butyl-1,4-benzohydroquinone; CCh, carbachol; CFP, cyan fluorescent protein; ER, endoplasmic reticulum; FRET, Förster resonance energy transfer; HEK293, human embryonic kidney 293; ICRAC, Ca2+ release-activated Ca2+ current; I–V, current–voltage; NFRET, normalized FRET; Orai1, Ca2+-release–activated Ca2+ channel 1; STIM1, stromal interaction molecule 1; TRIC, trimeric intracellular cation; YFP, yellow fluorescent protein.

