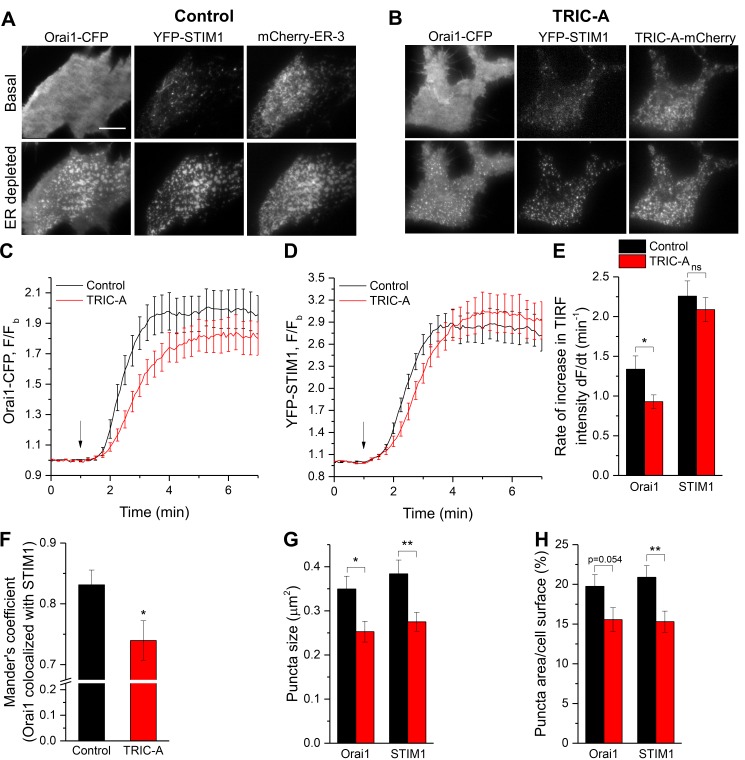
Fig 6. TRIC-A affects kinetics and extent of STIM1-Orai1 puncta formation upon store depletion.
(A, B) TIRF images of basal (top) and ER-depleted (100 μM CCh + 30 μM BHQ) (bottom) cell expressing Orai1-CFP (left, Orai1) and YFP-STIM1 (middle, STIM1) along with mCherry-ER-3 (right) (A, control) or TRIC-A-mCherry (right) (B, TRIC-A). Scale bar = 10 μm. (C, D) Traces show kinetics of Orai1-CFP and YFP-STIM1 TIRF intensity upon ER depletion (arrow) in TRIC-A (+) cells versus controls (n = 18 each). (E) Rate of increase in Orai1 and STIM1 TIRF intensity upon ER depletion shown in (C, D). (F) Mander’s coefficient showing proportion of Orai1 colocalized with STIM1, (G) average puncta size (μm2), and (H) puncta area relative to cell surface area (%) of Orai1 and STIM1 in TRIC-A (+) cells versus controls. *p < 0.05, **p < 0.01; mean values ± SEM are shown. Underlying data in panels (C–H) are included in S1 Data. BHQ, 2,5-Di-t-butyl-1,4-benzohydroquinone; CCh, carbachol; CFP, cyan fluorescent protein; ER, endoplasmic reticulum; Orai1, Ca2+-release–activated Ca2+ channel 1; STIM1, stromal interaction molecule 1; TIRF, total internal reflection fluorescence; TRIC, trimeric intracellular cation; YFP, yellow fluorescent protein.

