
Figure 1: Change in Weight by Frailty Status.
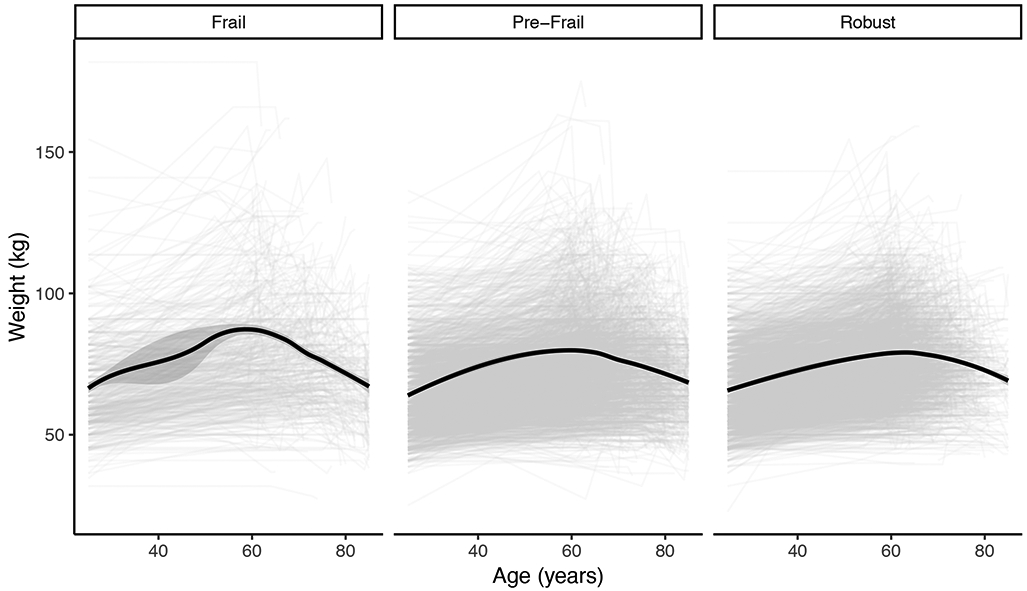
This figure represents a LOESS smoothed line demonstrating the change in weight as a function of age by frailty status.
Official websites use .gov
A
.gov website belongs to an official
government organization in the United States.
Secure .gov websites use HTTPS
A lock (
) or https:// means you've safely
connected to the .gov website. Share sensitive
information only on official, secure websites.
This figure represents a LOESS smoothed line demonstrating the change in weight as a function of age by frailty status.