
Figure 2: Repopulation of peripheral blood CD20+ B cells after renal allograft transplantation (n=40).
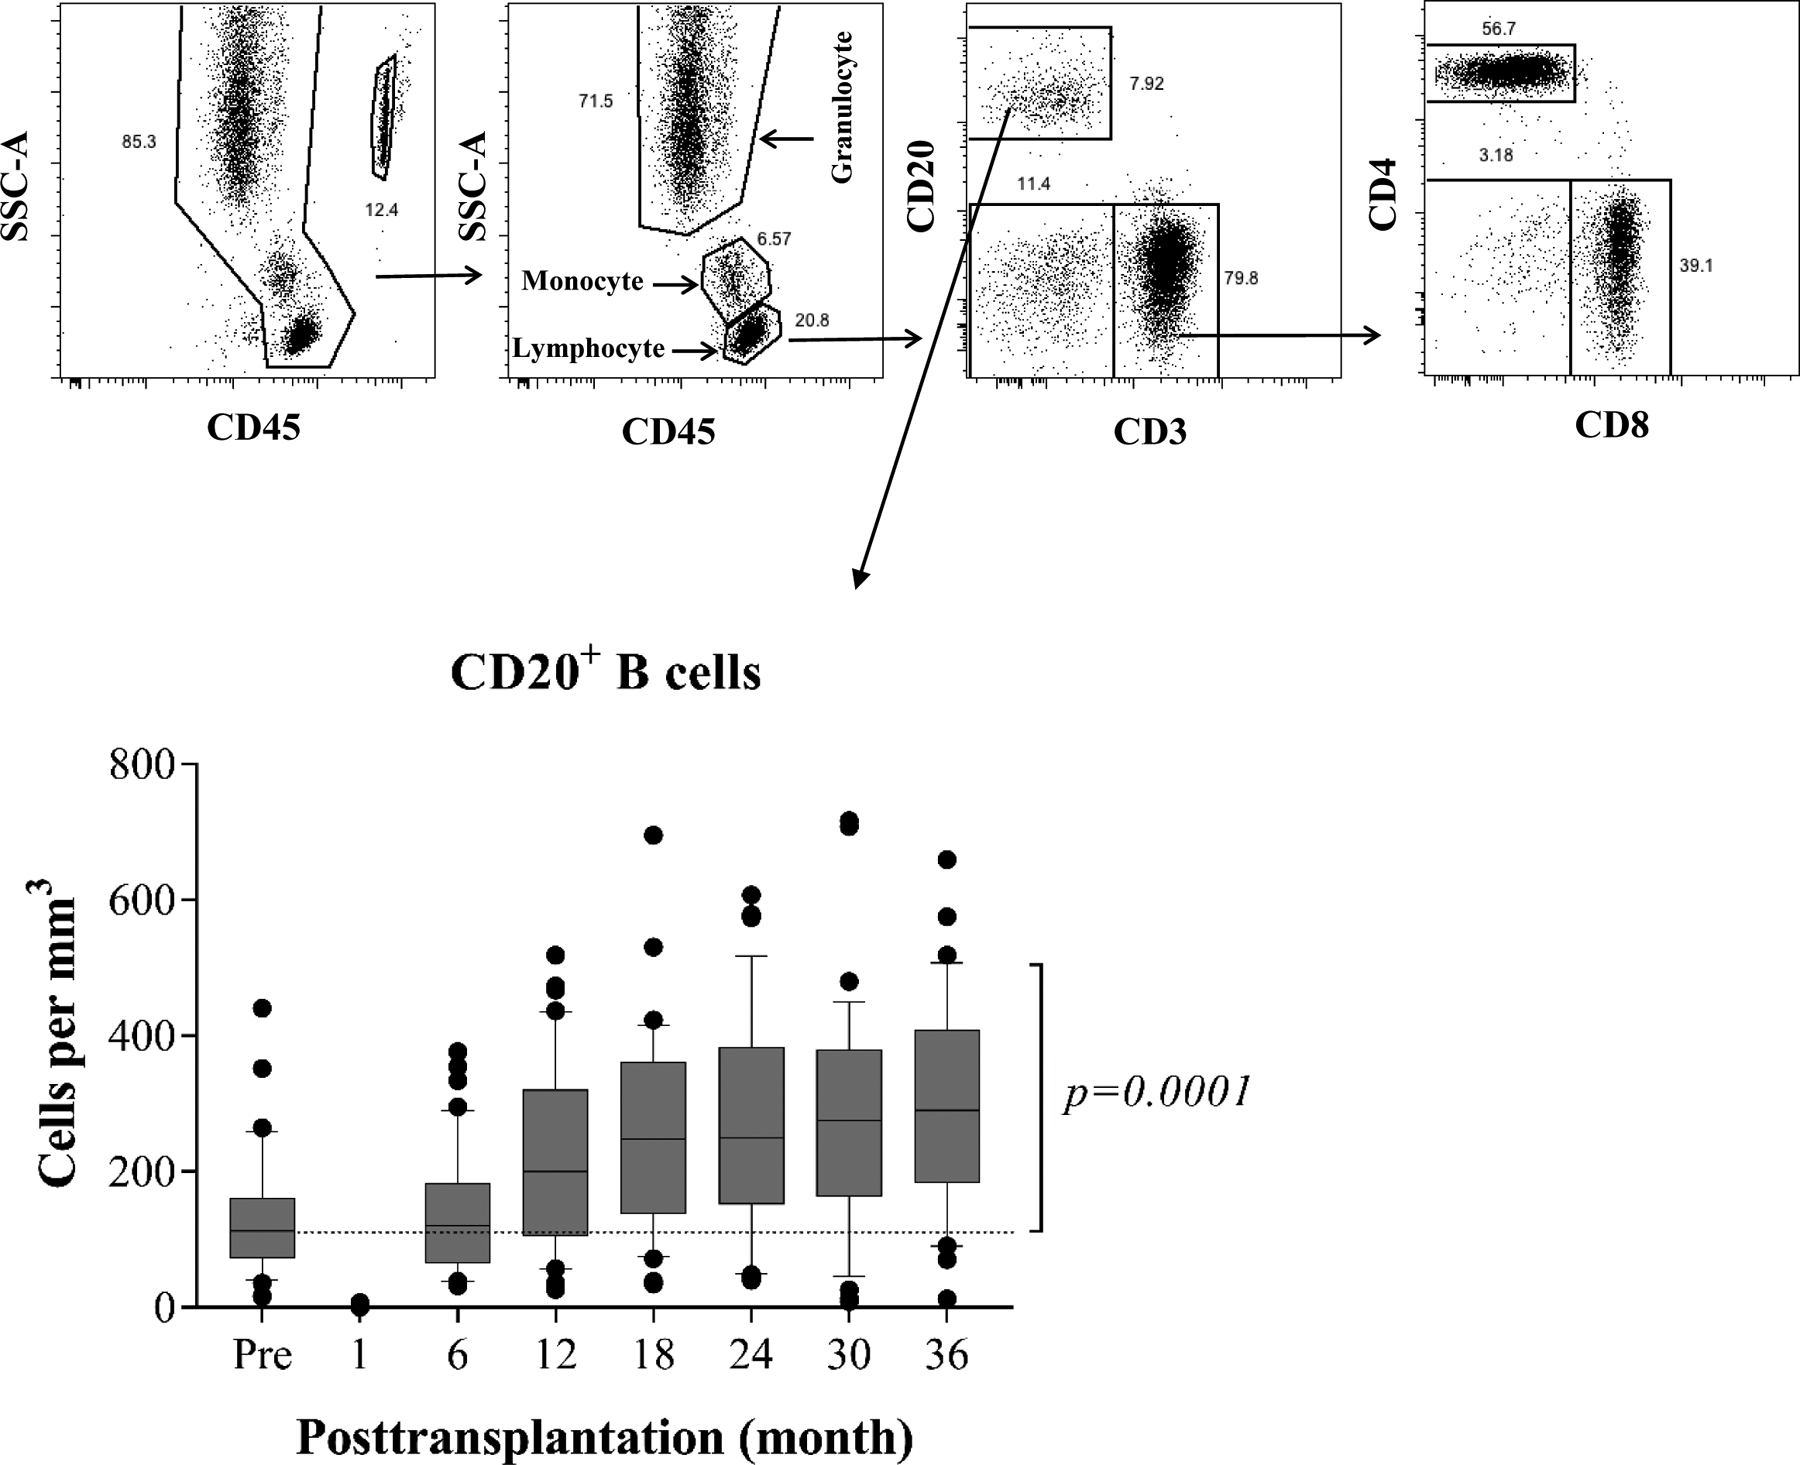
The absolute lymphocyte cell counts and subsets are analyzed by polychromatic flow cytometry, and a representative dot plots of gating strategy for B cell analysis (top). Profound T cell and B cell (CD3−CD20+) depletion is achieved with alemtuzumab induction followed by rapid repopulation to baseline level at 6 months, then significantly exceeding baseline values thereafter (bottom). The box borders indicate 75th and 25th percentile, and the line within box indicates median. Upper and lower whiskers represent 90th and 10th percentiles. The dots represent fifth and 95th percentiles.