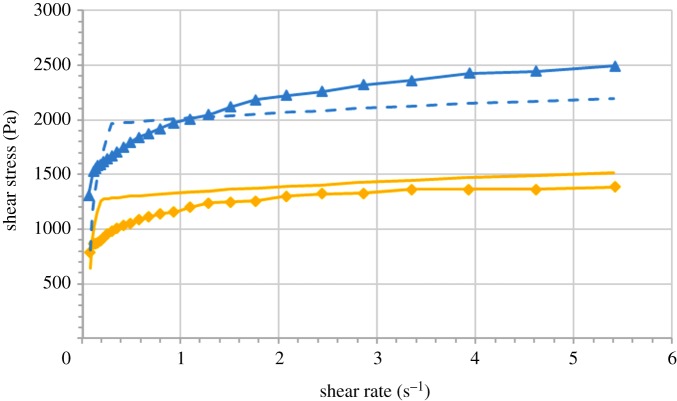
Figure 14.
Theory–experiment comparison for curves of shear stress versus shear rate, for sample 5Fe-15LVSA, under the application of magnetic fields of different strengths, H. Filled diamond, full curve, H = 156 kA m−1; filled triangle, dashed curve, H = 282 kA m−1. Filled diamond and filled triangle represent experimental data; full curve and dashed curve are predictions of the theoretical model (equation (4.12)). Parameters of the system for theoretical calculations: number of primary agglomerates in the undestroyed chains obtained by fitting are n = 8 and n = 9 for the magnetic fields of 156 kA m−1 and 282 kA m−1, respectively; volume concentration of clusters and viscosity . (Online version in colour.)

