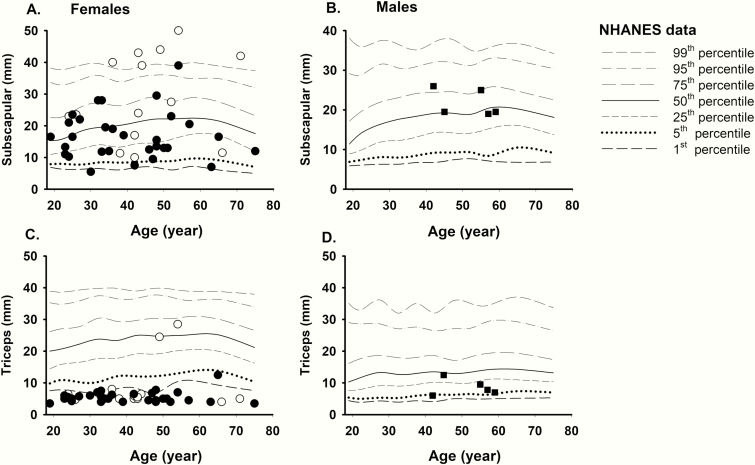
Figure 1.
Comparison of skinfold thickness values of FPLD2 subjects from UT Southwestern Medical Center cohort with the NHANES controls. Solid symbols signify subjects with “typical” LMNA variants vs unfilled symbols indicating “atypical” LMNA variants in females (circles) and males (squares). The data from the NHANES controls have been drawn as a percentile chart for comparison. (A) Female FPLD2 subjects have subscapular skinfold thickness values in the 5th to 95th percentile, except for 1 subject who had less than 1st percentile. (B) Male FPLD2 subject have subscapular skin folds in the 25th to 75th percentile with no specific trend. (C) The triceps skinfold measurements are <1st percentile in the majority of the female FPLD2 subjects except for 5 patients. (D) All 5 males with FPLD2 had triceps skin fold values in 5th to 50th percentile with no specific trend. FPLD2, familial partial lipodystrophy, Dunnigan variety; NHANES, National Health and Nutrition Examination Survey.

