
Fig. 5. A sucrose SA–activated mPFC ensemble is not involved in cue-induced sucrose seeking.
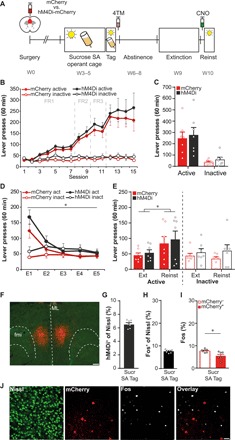
(A) Experimental design. Groups: mCherry (N = 7) and hM4Di-mCherry (N = 7). (B) Acquisition of sucrose SA was similar in both groups. (C) Tag session. Lever pressing did not differ between the groups. (D) Active lever pressing declined over extinction sessions. *P < 0.001. (E) Cue reexposure reinstated active lever pressing (*P = 0.026), but CNO-mediated suppression of the sucrose SA–tagged ensemble did not affect sucrose seeking. Inactive lever presses did not differ between sessions and groups. (F) Example of mPFC sucrose SA–tagged hM4Di-mCherry+ expression. Scale bar, 250 μm. (G) The sucrose SA–tagged ensemble comprised 6.6 ± 0.2% of the total neuronal mPFC population. (H) A second reinstatement test evoked Fos expression in 7.6 ± 0.3% of mPFC neurons. (I) Percentage of Fos+ within the mCherry− and mCherry+ populations. Colocalization of Fos with mCherry+ population was lower than colocalization with mCherry− population. *P = 0.020. (J) Example images of Fos+ and mCherry+ cells in the mPFC. Scale bar, 50 μm. All bar graphs, means + SEM.