
Fig. 6. Alcohol SA– and sucrose SA–tagged ensembles differ in composition and efferent projections.
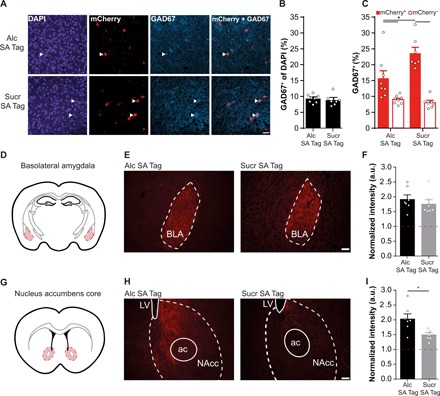
(A) Representative images of nuclei [4′,6-diamidino-2-phenylindole (DAPI)], ensemble neurons (mCherry+), and GABAergic (GAD67+) cells in the mPFC of alcohol SA–tagged (Alc SA Tag) and sucrose SA–tagged (Sucr SA Tag) mice. White arrowheads indicate colocalization of GAD67 and mCherry. Scale bar, 50 μm. (B) Percentage of GAD67+ cells in the mPFC was similar between alcohol SA (N = 8) and sucrose SA (N = 7) groups (9.2 ± 0.5 and 8.8 ± 0.7% of DAPI, respectively). (C) Percentage of GAD67+ within the mCherry− (DAPI+) and mCherry+ populations. Colocalization of GAD67+ with the mCherry+ population was higher in the sucrose SA–tagged than the alcohol SA–tagged group. *P = 0.015. (D) Schematic of the BLA region (BLA; shaded red) that was imaged for analysis of projections of mPFC ensembles. (E) Representative images of axonal fibers (mCherry+) of alcohol SA– and sucrose SA–tagged mPFC ensembles. Scale bar, 100 μm. (F) Fiber intensity in the BLA did not differ between the alcohol SA– and sucrose SA–tagged ensemble. (G) Schematic of the NAcc region (shaded red) that was imaged for analysis of projections of mPFC ensembles. (H) Representative images of axonal fibers (mCherry+) of the alcohol SA– and sucrose SA–tagged mPFC ensemble. Scale bar, 100 μm. LV, lateral ventricle; ac, anterior commissure, olfactory limb. (I) Intensity of the alcohol SA–tagged ensemble fibers was higher than those of the sucrose SA–tagged ensemble in the NAcc (P = 0.012). *P < 0.012. a.u., arbitrary units.