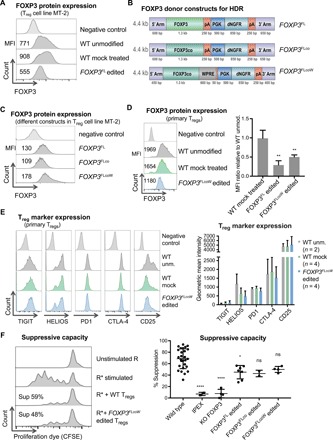
Fig. 3. FOXP3 edited Tregs express FOXP3 protein and display characteristic in vitro phenotype and function.

(A) Quantification of FOXP3 protein expression in the MT-2 Treg cell line by flow cytometry, showing median fluorescence intensity (MFI) values for one representative experiment out of three performed. (B) FOXP3 homology donor constructs designed to improve FOXP3 protein expression, including further codon optimization (FOXP3FLco) and addition of a WPRE element (FOXP3FLcoW). (C) Flow cytometry for FOXP3 in MT-2 cells comparing the different donor constructs. (D) FOXP3 expression in primary Tregs by flow cytometry and quantification represented as ratio of MFI in treated cells versus WT unmodified Tregs [mean ± SD, one-way analysis of variance (ANOVA), Tukey’s multiple comparisons]. Significance comparing FOXP3FL (n = 2, **P < 0.01) or FOXP3FLcoW (n = 6, **P < 0.01) to WT mock treated (n = 2). (E) Expression of signature Treg marker proteins on primary Tregs by flow cytometry and corresponding quantification (mean ± SD, n = 2 to 4). (F) Suppression assay showing unstimulated responders (R), stimulated responders (R*) alone or in coculture with Tregs, and calculated percent suppression. Responders stained with proliferation dye, carboxyfluorescein diacetate succinimidyl ester (CFSE). Average suppressive potential over several independent experiments is quantified (right). Significance comparing the WT Tregs with following Tregs: IPEX, FOXP3 KO, FOXP3FL edited, FOXP3FLco edited, and FOXP3FLcoW edited (mean ± SD, one-way ANOVA, Tukey’s multiple comparisons test, *P < 0.05; ****P < 0.0001; ns, not significant).
