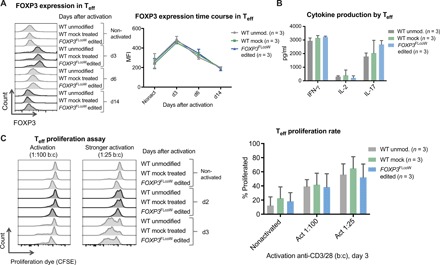
Fig. 4. FOXP3 editing of Teff cells preserves physiological regulation of FOXP3 expression and in vitro function.

(A) Flow cytometry time course showing kinetics of FOXP3 expression in nonactivated Teff cells and activated Teff cells on subsequent days after activation [day 3 (d3), d6, and d14], comparing WT unmodified, WT mock-treated, and FOXP3FLcoW edited Teff cells. FOXP3 expression quantified in Teff cells over time course of activation, showing average MFI (mean ± SD, n = 3). (B) Cytokine production in WT and FOXP3 gene edited Teff cells determined by enzyme-linked immunosorbent assay (ELISA). Supernatants collected at 24 hours (IL-2) and 48 hours (IFN-γ and IL-17) after activation with anti-CD3/28 (mean ± SD, n = 3). (C) Teff cell proliferation in response to activation measured by the proliferation assay. Flow cytometry plots of carboxyfluorescein diacetate succinimidyl ester (CFSE) dye–stained Teff cells with progressive dilution of dye as proliferation progresses from nonactivated to day 2 and day 3 after activation with anti-CD3/28 Dynabeads are shown. Comparison of proliferation rates in response to activation with a bead:cell ratio of 1:100 and 1:25. Quantification of average proliferative response of Teff cells from proliferation assay at day 3 is shown to the right, comparing different doses of activation beads (mean ± SD, n = 3).
