
Fig. 4. Treg cell numbers and global cytokine profiles in NOD mice treated with CPMV-derived particles.
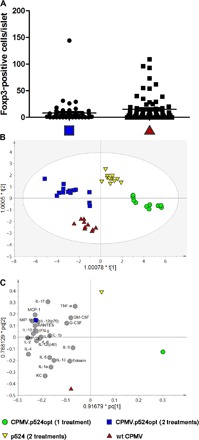
Mice treated with two doses of CPMV.p524opt and mice treated with the wt CPMV particles show no significant difference in the number of Foxp3+ T cells (A). OPLS-DA score scatter plot (B) and loading scatter plot (C) of the preclinical study model (explained variance = 44.7%) with two doses (blue square) or one dose (white circle) of CPMV.p524opt, with the wt CPMV (red triangle) and with p524 synthetic peptide (yellow triangle). OPLS-DA model = 3 + 6 + 0, R2X(cum) = 0.919, R2Y(cum) = 0.878, Q2(cum) = 0.764. In the loading scatter plot (C), the green dots show the contribution of each cytokine to the statistical classes listed above. The global cytokine profile shows the activation of different cytokines in mice treated twice with wt CPMV (red triangle) and CPMV.p524opt (blue square). Mice treated twice with the synthetic p524opt peptide (yellow triangle) or once with CPMV.p524opt (green circle) do not show specific activation profiles compared to the other treatment groups.