
Fig. 4. Modulation of axonal spike amplitude.
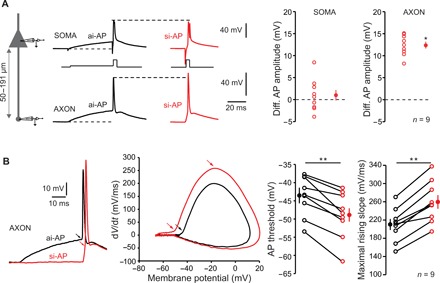
(A) ISF is associated with a modulation of axonal spike amplitude. Left: Recording configuration. Simultaneous whole-cell recordings from the soma and cut end axon in L5 pyramidal cells were obtained. Middle: Comparison of somatic and axonal AP amplitudes evoked by asynchronous-like (black traces) and synchronous-like (red traces) inputs. Note the increased amplitude in the axon but not in the soma. Resting membrane potential: −78 mV. Right: Quantitative data (Wilcoxon test, *P < 0.05). (B) Hyperpolarization of spike threshold and increase in the slope of the spike rising-phase during ISF (Wilcoxon test, **P < 0.01). Left: Comparison of axonal spikes induced by asynchronous and synchronous inputs. Resting membrane potential: −80 mV. Middle: Phase-plot of the APs. Note the hyperpolarization of the threshold during and the increase of maximal slope during ISF. Right: Quantitative data.