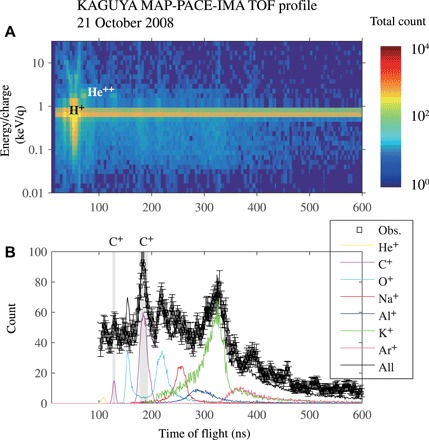
Fig. 2. Observation data by IMA on KAGUYA on 21 October 2008.

(A) Energy TOF/mass profile of ions. PACE, Plasma energy Angle and Composition Experiment. (B) TOF/mass profile of low-energy (<~500 eV) ions derived from data in (A). The black curve is the sum of all calibration curves (colored lines) with random noise to fit the observation data (rectangles). The error bars indicate a confidence interval of 68% (1σ). Three TOF peaks are generated by one sort of incident ions, since ultrathin foil was used for start signals, which resulted in their charge state being converted to negative, neutral, or positive particles in the TOF chamber (21). For the incident C+, the peaks at 140 and 200 ns were made by C− and a combination of C and C+, respectively.
