
Fig. 3. Continuous wavelet and spectral results of arboreal pollen (AP%) from the Zoige Basin core ZB13-C2.
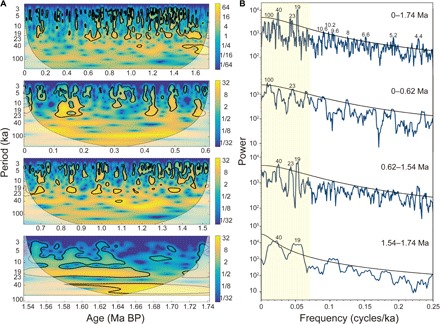
(A) The continuous wavelet and (B) the multitaper method spectral results for the intervals of 0–1.74, 0–0.62, 0.62–1.54, and 1.54–1.74 Ma BP. The data were resampled at equally spaced 0.6-ka intervals and detrended before analysis. AP% generally shows powers of ~40, 20, 10.6 to 9.6, 8, 6.6, 5.2, and 4.4 to 4.1 ka. Black lines denote the 90% confidence level. The ~100-ka cycle becomes established in the past ~0.62 Ma, along with an intermittent ~20-ka cycle and a weak ~40-ka cycle.