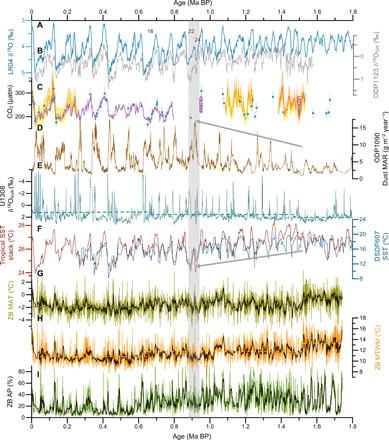
Fig. 4. Correlation of vegetation and temperature records from the Zoige Basin core ZB13-C2 with global and regional climate records over the past 1.74 Ma.

(A) LR04 global benthic δ18O stack (blue) (10). The numbers denote the MIS. (B) Seawater δ18O (23) at ODP 1123 (gray), east of New Zealand, which is a direct indicator of ice volume. (C) CO2 records are shown as follows: orange, δ11B-based data from the Caribbean (27) and eastern tropical Atlantic (31); blue squares, low-resolution δ11B record from the equatorial Atlantic (all with 2σ error bars/envelopes) (29); purple circle, ice core CO2 measurements from blue ice (30); purple line, ice core compilation (36). (D) Southern Ocean dust mass accumulation rate (MAR) (33). (E) Bulk carbonate δ18O at site U1308, north Atlantic (11). The dashed lines indicate the mean values for three intervals. (F) Estimates of SST at site DSDP 607 (20), north Atlantic, and tropical stack (21). (G) Reconstructed MAT and 9-point running mean (black line) from ZB13-C2 (this study). The dashed lines indicate the mean values of MAT for three intervals. (H) Reconstructed MTWM and 9-point running mean (black line) from ZB13-C2 (this study). The dashed lines indicate the mean values of MTWM for three intervals. (I) Arboreal pollen percentages (~600-year resolution) from ZB13-C2. Black line shows the 9-point running mean.
