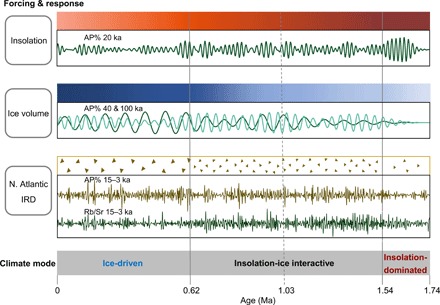
Fig. 5. Schematic diagram of the forcings of Zoige Basin vegetation and climate change modes at orbital and millennial scales over the past 1.74 Ma.

The dark colors in the bars represent the trends of the strength of the forcings (low-latitude insolation and ice volume). The triangles demonstrate the frequency and strength of northern Atlantic ice-rated debris (IRD) variabilities. The curves show the Zoige-filtered AP% values centered around 20-, 40-, 100-ka bands, and the millennial variabilities of AP% (green) and Rb/Sr ratio (brown) at the powers between 15 and 3 ka.
