FIG. 4.
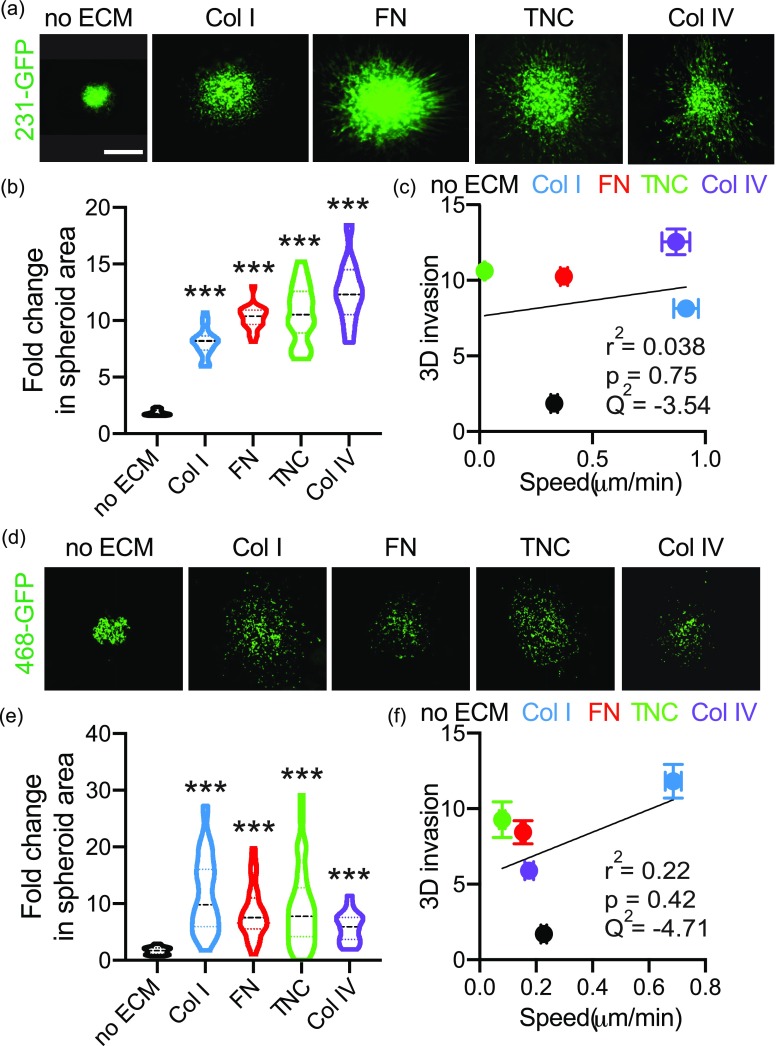
ECM-driven 3D invasion does not correlate with effects on 2D cell migration. (a) Representative images of spheroids made from 231-GFP cells embedded in media, Collagen I, Fibronectin, Tenascin C, or Collagen IV gels for 5 days. The scale bar is 200 μm. (b) Quantification of fold change in 231-GFP spheroid area on day 5 relative to day 1. Data pooled from at least five biological replicates, with three technical triplicate per experiment. ***p < 0.001 by one-way ANOVA and Dunn's multiple comparison test. (c) Correlation between mean fold change in spheroid area and 2D cell migration speed for 231-GFP cells. Correlation characterized by r2, p value and Q2. (d) Representative images of spheroids made from 468-GFP cells embedded in media, Collagen I, Fibronectin, Tenascin C, or Collagen IV gels for 5 days. Scale bar is 200 μm. (e) Quantification of fold change in 468-GFP spheroid area on day 5 relative to day 1. Data pooled from at least four biological replicates, with three technical triplicate per experiment. ***p < 0.001 by one-way ANOVA and Dunn's multiple comparison test. (f) Correlation between mean fold change in spheroid area and 2D cell migration speed for 468-GFP. Correlation characterized by r2, p value, and Q2.

