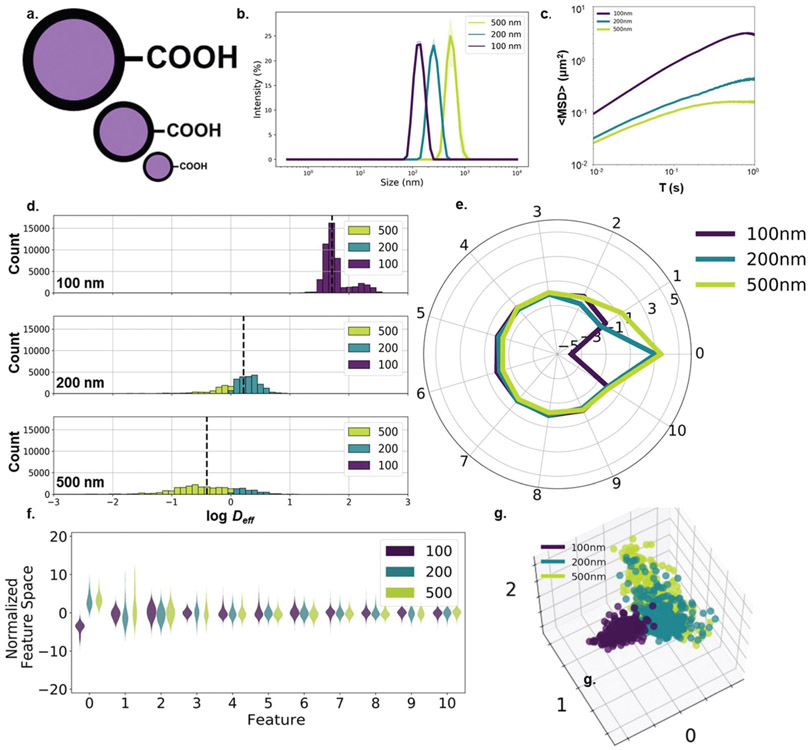
Fig. 1.
Size-dependent nanoparticle diffusion analysis. (a) 100-, 200-, and 500 nm carboxyl-modified polystyrene particles. (b) Hydrodynamic diameter (intensity mean) distributions (purple: 100 nm, teal: 200 nm, yellow-green: 500 nm) measured in 10 mM NaCl (n = 3 measurements). (c) 〈MSD〉 profiles of PS-COOH nanoparticles of varying size (n = 2 wells per particle size, n = 5 videos per well). (d) log Deff distributions stratified by particle size and binned by predicted particle size using the Stokes–Einstein based predictor with anomalous diffusion exponent. (e) Average component profile of PCA analysis stratified by particle size. (f) Principle component distributions of PCA analysis stratified by particle size. (g) The first three primary components of 400 randomly selected trajectories per size plotted against each other.

